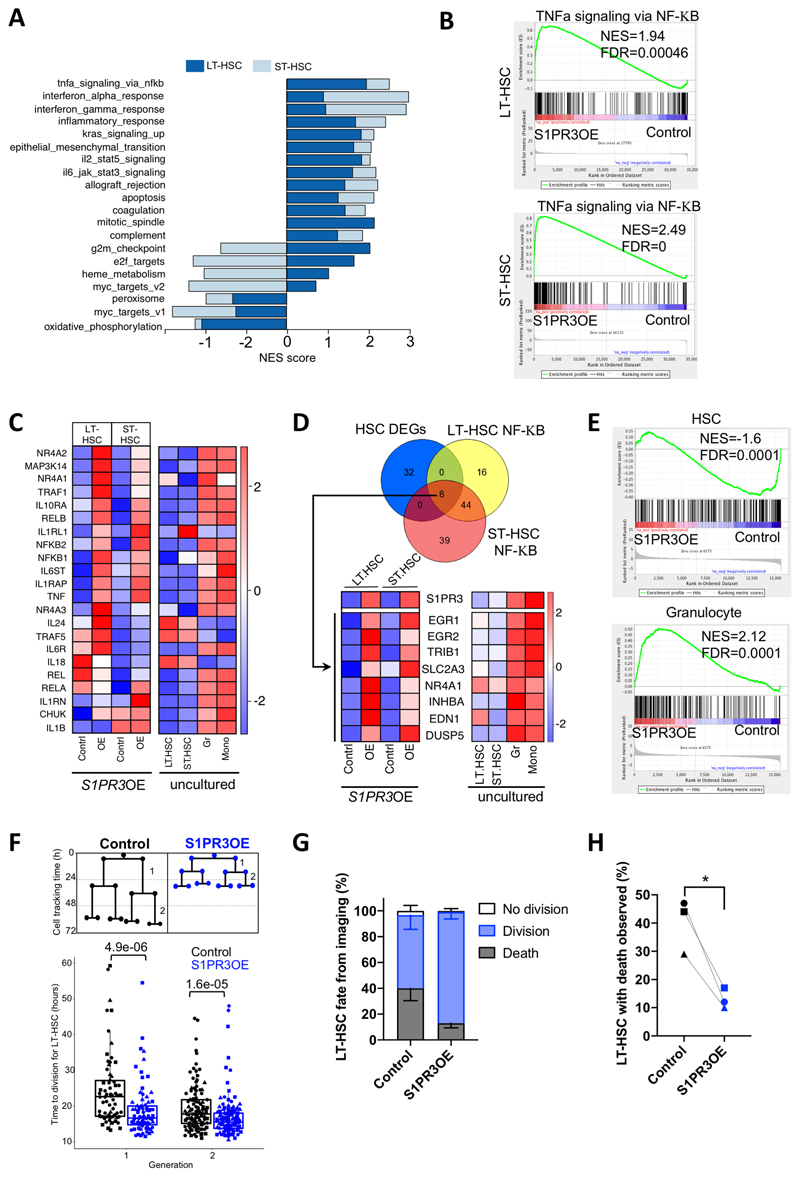
Figure 3. S1PR3 overexpression induces a myeloid inflammatory program in HSC.
A, Normalized enrichment scores (NES) for the pathways that are significantly different between control and S1PR3OE cells (FDR<0.01) in LT-HSC and ST-HSC (superimposed), following GSEA of the MSigDB v6.2 Hallmark gene sets in RNA-seq expression data, data from 3 CBs. S1PR3OE strongly upregulates inflammatory pathways in both HSC subsets. B, GSEA plots of TNFα via NF-κB Hallmarks gene set for LT-HSC and ST-HSC. C, Heatmap showing the median expression of selected NF-κB pathway genes, associated with both the canonical and non-canonical signaling pathway, and inflammatory cytokines and receptor genes from the S1PR3OE RNA-seq and uncultured LT-HSC, ST-HSC, granulocytes (Gr) and monocytes (Mono). The majority of genes are highly expressed in myeloid lineages, and are upregulated with S1PR3OE in the HSC subsets. Of note, a number of inflammation genes exhibit distinct expression patterns in LT-HSC and ST-HSC with S1PR3OE including TRAF5, IL1RL1, IL18, IL24 (an IL10 family member), and IL1B. D, Venn diagram representing the intersection of 40 significantly differentially expressed genes (DEGs, FDR<0.05) in S1PR3OE from both LT- and ST-HSC compared to control and leading edge genes of the NF-κB gene set in both LT-HSC and ST-HSC. The 8 genes found in the intersection pointed to upregulation of an EGR1/2 associated myeloid transcriptional network. Heatmaps of the median expression of these 8 genes and S1PR3 in control and S1PR3OE (OE) at day 3 compared to uncultured LT-HSC, ST-HSC, Gr and Mono are shown. E, GSEA plots for previously published HSC and granulocyte gene sets indicates S1PR3OE enriches for granulocyte and depletes HSC identity in genes common for LT-HSC and ST-HSC S1PR3OE RNA-seq (see Supplementary Fig. S4C-E for individual GSEA plots for LT-HSC and ST-HSC and enrichment map of pathways altered by S1PR3OE). F, Quantification of time to division for single cells tracked in the first two generations of control (n=34) or S1PR3OE (n=41) transduced LT-HSC beginning at day 3 post-transduction by time-lapse imaging (3 CB, marked by different symbols). Statistical significance by Mann-Whitney test. G, Distribution of division, death or no division fate for control (n=179) or S1PR3OE (n=198) LT-HSC cells tracked from 3 independent experiments. H, Percentage of LT-HSC (e) that died during time-lapse movies for control and S1PR3OE vectors. Paired T-test, * p<0.05.

