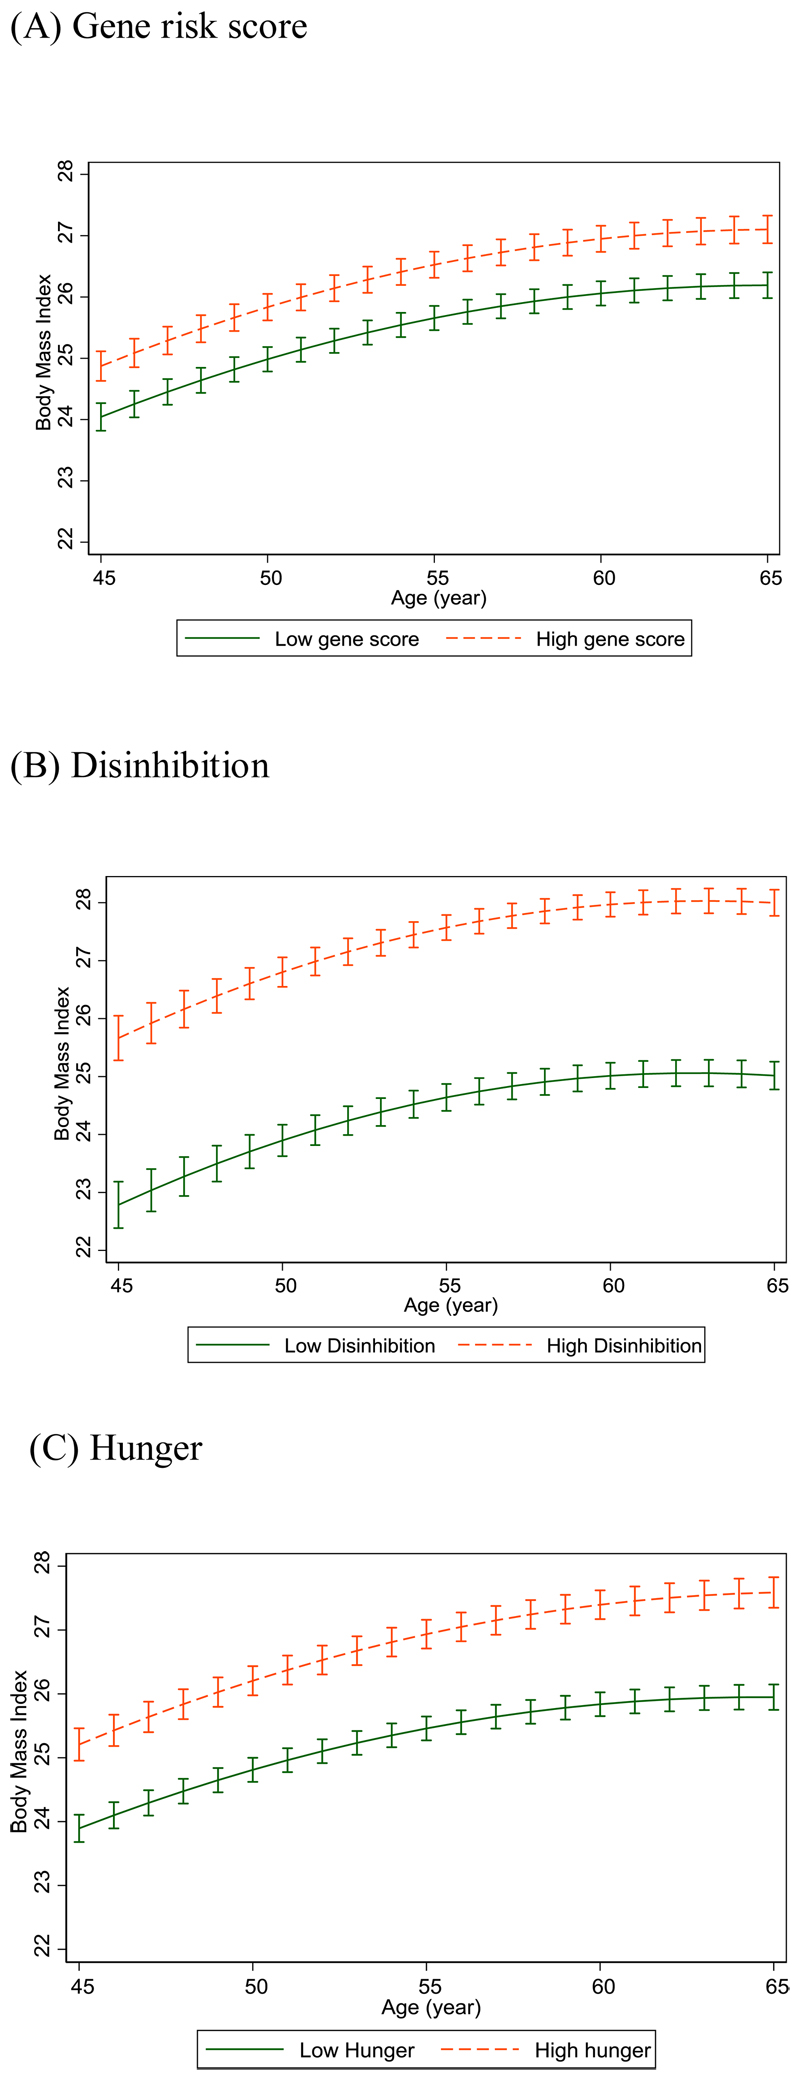
Fig. 1. BMI trajectories to age 65, predictions from longitudinal model with gene risk score and each eating behavior. (N=2464).
Error bars show 95% CI around fixed effects. Orange dashed line indicates those with gene risk score or eating behavior above median; Green solid line indicates those with gene risk score or eating behavior below median. BMI values are adjusted for sex and birth cohort effects.

