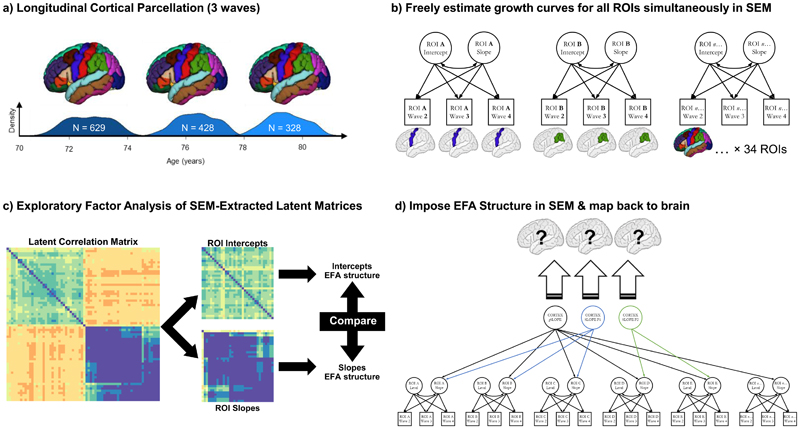
Figure 1. Analysis pipeline for establishing dimensions of brain cortical ageing.
Note. a) T1-W brain MRI volumes were parcellated into 34 regions per hemisphere using the FreeSurfer longitudinal pipeline, at 3 waves from c.70-80 years old; b) we then simultaneously estimated growth curves (freely-estimated latent intercepts and slopes) for each region of interest (ROI) simultaneously, with a structural equation model (SEM); c) we extracted the resultant latent correlation matrix from the SEM in (b), separated these into intercepts and slopes used these matrices to investigate their correlational structure, using a Schmid-Leiman exploratory factor analyses (EFA). We ran formal tests to compare this structure across hemispheres (left v right) and between intercepts and slopes; d) we then conducted a confirmatory factor analysis (CFA); here we took the same model as in (b), but now imposed the three-factor structure implied by the EFA in (c), rather than freely estimating the slopes of each ROI. ROI latent intercepts were allowed to covary with all latent factors (not shown). The magnitude of the loadings for each of the factors was then mapped back onto the brain ROIs, indicating the groups of regions where atrophy is correlated, and allowing us to ask how these changes are correlated with genetic and cognitive status (e.g. Figure 4).

