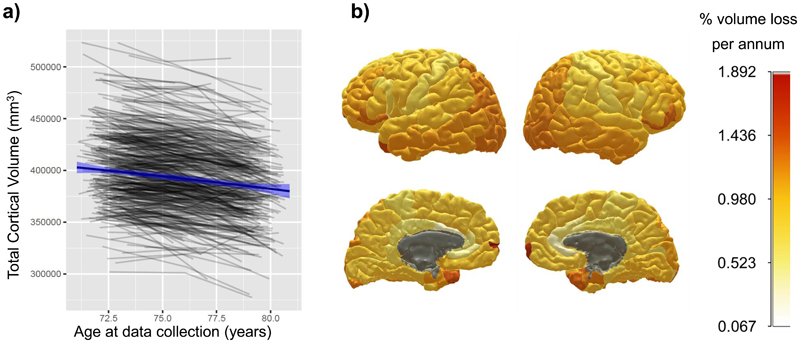
Figure 2. Global and regional cortical volumetric change from age 70 to 81 years of age.
Note. a) shows, in grey lines, individual trajectories of global cortical volume; blue line denotes the mean linear trajectory with 95% CIs. b) shows the mean % loss per annum, estimated by growth curve models, for each cortical region of interest; warmer colours denote a steeper decline (grey areas indicate non-significant change). Individual plots by region are shown in Supplementary Figure 3.

