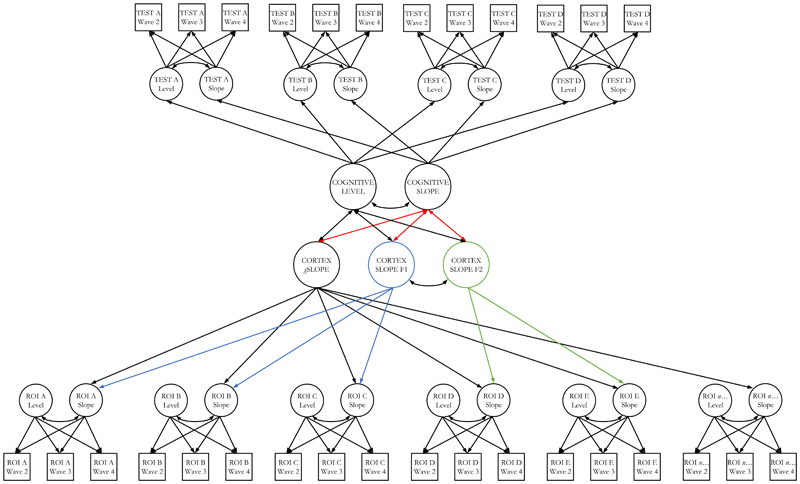
Figure 5. Modelling the coupled changes between cortical factors and cognitive domains.
Note. An example of a multivariate latent growth curve model assessing associations between cortical and cognitive changes. The top half of the model illustrates how the intercept and slope of a given cognitive domain is indicated by the individual intercept and slope of multiple individual cognitive tests, tested on 3 occasions. The bottom half of the model illustrates how the 3 factors of cortical change are differentially indicated by the individual slopes of each of 34 cortical regions of interest (ROI). Residual correlations among manifest variables not shown. ROI intercept factors were freely estimated and allowed to correlate with all latent factors (not shown to reduce figure complexity). Red paths denote associations of interest, between cognitive and cortical changes. The two ‘secondary’ factors of cortical volume (F1 and f2) are orthogonal to the general slope of cortical volume, and negatively correlated with each other (r = -0.254, p < 0.001).

