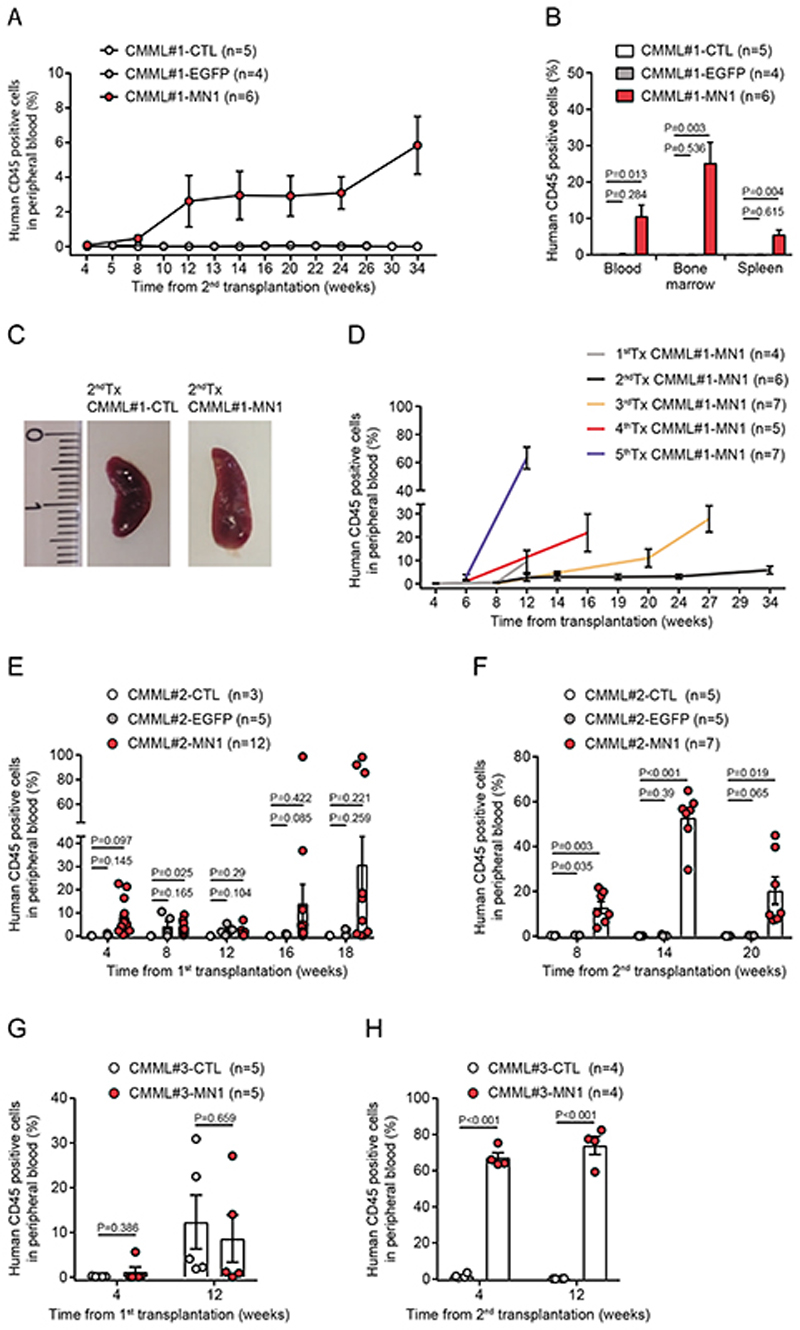
Figure 2. CMML-MN1 cells engraft secondary recipient mice and are serially transplantable.
A) Engraftment of human hematopoietic cells (CD45 positive) in the peripheral blood of secondary recipient NSGS mice monitored at the indicated time points (number of analyzed mice is indicated in the figure; mean ± SEM).
B) Engraftment of CMML#1-MN1 cells in peripheral blood, bone marrow and spleen of secondary recipient NSGS mice at sacrifice (number of analyzed mice is indicated in the figure; mean ± SEM).
C) Representative photographs of spleens from secondary recipient mice transplanted with bone marrow from primary recipient mice which had received either untransduced CMML#1 cells (CMML#1-CTL) or MN1-transduced CMML#1 cells (CMML#1-MN1) (scale bar indicates millimeters).
D) Engraftment of CMML#1-MN1 cells in serial transplantations shown as percentage of human CD45 positive cells detected in peripheral blood at the indicated time points (number of analyzed mice is indicated in the figure; mean ± SEM).
E) Engraftment of CMML#2 cells in the peripheral blood of primary recipient NSGS mice transplanted with untransduced CMML#2 (CMML#2-CTL), EGFP (control vector) transduced CMML#2 (CMML#2-EGFP) or MN1-transduced CMML#2 cells (CMML#2-MN1), (number of analyzed mice is indicated in the figure; mean ± SEM).
F) Engraftment of CMML#2 cells (from Figure 2E) in the peripheral blood of secondary recipient NSGS mice at the indicated time points (number of analyzed mice is indicated in the figure; mean ± SEM).
G) Engraftment of CMML#3 cells in the peripheral blood of primary recipient NSGS mice transplanted with untransduced CMML#3 (CMML#3-CTL) or MN1-transduced CMML#3 cells (CMML#3-MN1), (number of analyzed mice is indicated in the figure; mean ± SEM).
H) Engraftment of CMML#3 cells (from Figure 2G) in the peripheral blood of secondary recipient NSGS mice at the indicated time points (number of analyzed mice is indicated in the figure; mean ± SEM).

