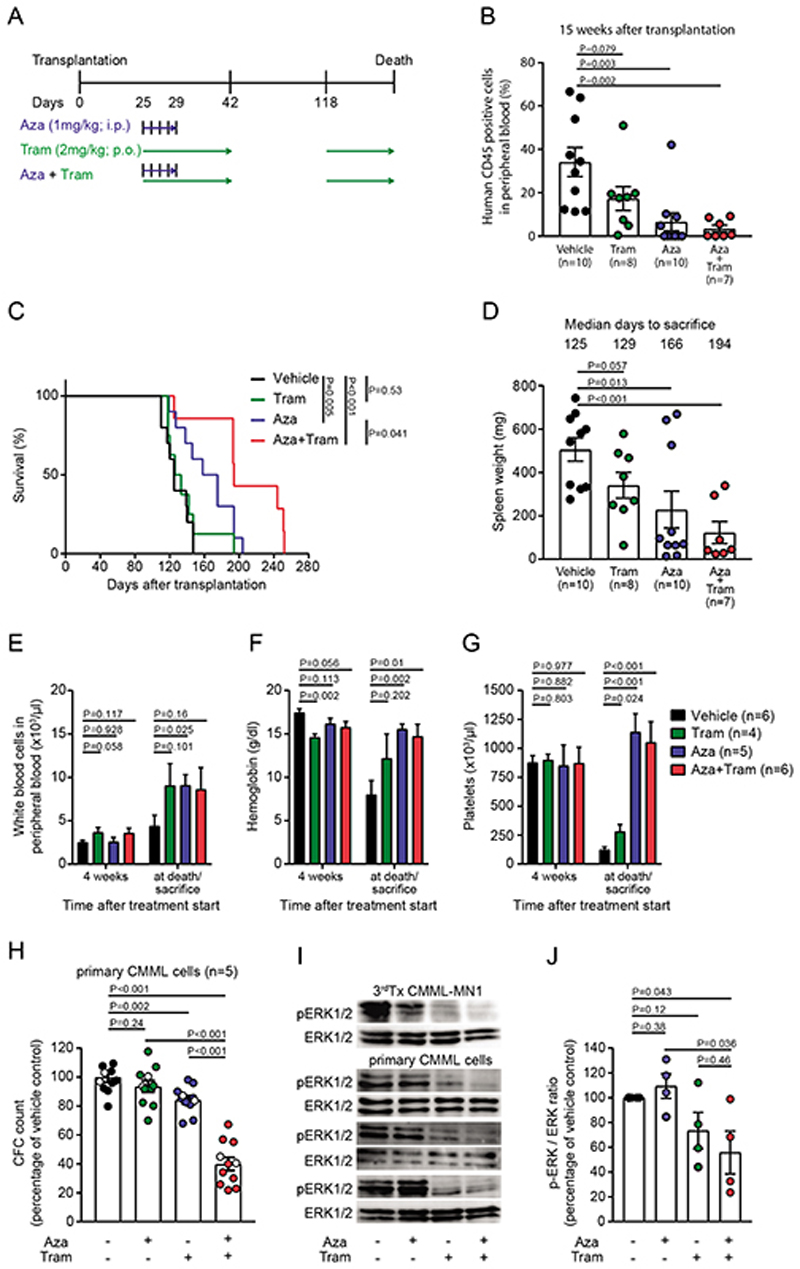
Figure 5. The MEK-inhibitor trametinib prolongs survival of CMML#1-MN1 mice when combined with azacitidine.
A) Schematic representation of the treatment regimens (Aza, azacitidine; Tram, trametinib).
B) Monitoring of CMML burden in recipient mice at week 15 after transplantation (each dot represents one mouse; mean ± SEM)
C) Survival of NSGS recipient mice engrafted with CMML#1-MN1 cells and treated with vehicle (n=10), trametinib (n=8), azacitidine (n=10) and the combination of trametinib+azacitidine (n=7).
D) Spleen weight of NSGS recipient mice engrafted with CMML#1-MN1 cells and treated with vehicle, trametinib, azacitidine and the combination of trametinib+azacitidine at sacrifice (each dot represents one mouse; mean ± SEM).
E) White blood cell count in peripheral blood of CMML#1-MN1 bearing mice treated with vehicle, trametinib, azacitidine and the combination of trametinib+azacitidine 4 weeks after treatment start and at sacrifice (number of individual mice is indicated in the figure; mean ± SEM).
F) Hemoglobin levels in peripheral blood of CMML#1-MN1 bearing mice treated with vehicle, trametinib, azacitidine and the combination of trametinib+azacitidine 4 weeks after treatment start and at sacrifice (number of individual mice is indicated in the figure; mean ± SEM).
G) Platelet count in peripheral blood of CMML#1-MN1 bearing mice treated with vehicle, trametinib, azacitidine and the combination of trametinib+azacitidine 4 weeks after treatment start and at sacrifice (number of individual mice is indicated in the figure; mean ± SEM).
H) Effect of the combination treatment in five different CMML patients (unrelated to the CMML#1-MN1 cells). Primary CMML cells were treated with vehicle, azacitidine (500 nM), trametinib (20 nM) or the combination of azacitidine (500 nM) + trametinib (20 nM) and plated in duplicate in CFC media. After 20 days colonies were counted and expressed as percentage of the vehicle treated cells. White dots within all groups represent cells from a patient without mutation in a signaling gene (n=5, mean ± SEM).
I) Immunoblotting for p-ERK and ERK in azacitidine/trametinib- and vehicle-treated CMML patients (n=3) and CMML#1-MN1 (n=1) cells from third recipient mice at 6h after treatment.
J) Average p-ERK-to-ERK ratio from immunoblots shown in Figure 5I as percentage of vehicle treated CMML cells (n=4, mean ± SEM).

