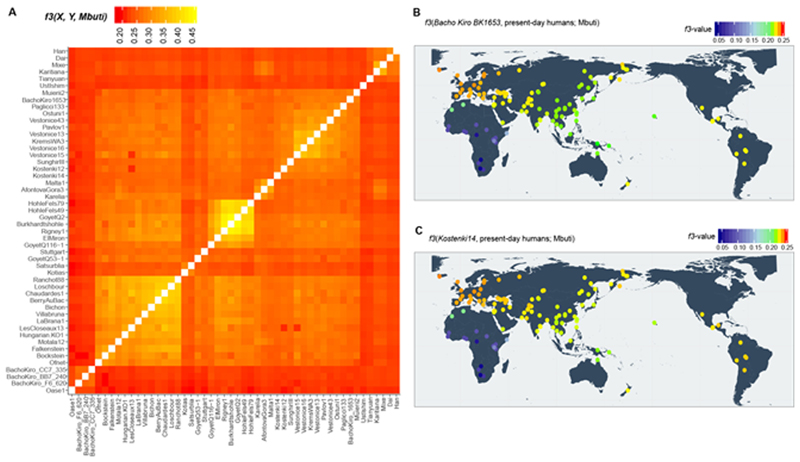
Extended Data Fig. 3. Heatmaps of outgroupf3-statistics corresponding to the amount of shared genetic drift between individuals and/or populations.
a, Genetic clustering of ancient individuals, including IUP Bacho Kiro Cave individuals, BK1653 and Oase1 based on the amount of shared genetic drift and calculated as f3(ancient1, ancient2; Mbuti). Lighter colours in this panel indicate higher f3 values and correspond to higher shared genetic drift (nsnps = 2,056,573). b, c, Shared genetic drift between approximately 35,000-year-old BK1653 (b; nsnps = 825,379) or approximately 38,000-year-old Kostenki14 individuals29,30 (c; nsnps = 1,676,430) and present-day human populations from the SGDP31 calculated as f3(Bacho Kiro BK1653/Kostenki14, present-day humans; Mbuti). Three Mbuti individuals from the same panel31 were used as an outgroup. Higher f3 values47 are indicated with warmer colours and correspond to higher shared genetic drift. Plotted f values were calculated using ADMIXTOOLS28 as implemented in admixr61. Coordinates for present-day humans were previously published31. The heatmap scale is consistent with those in Fig. 2a, Supplementary Figs. 5.1, 5.2.

