Fig. 3.
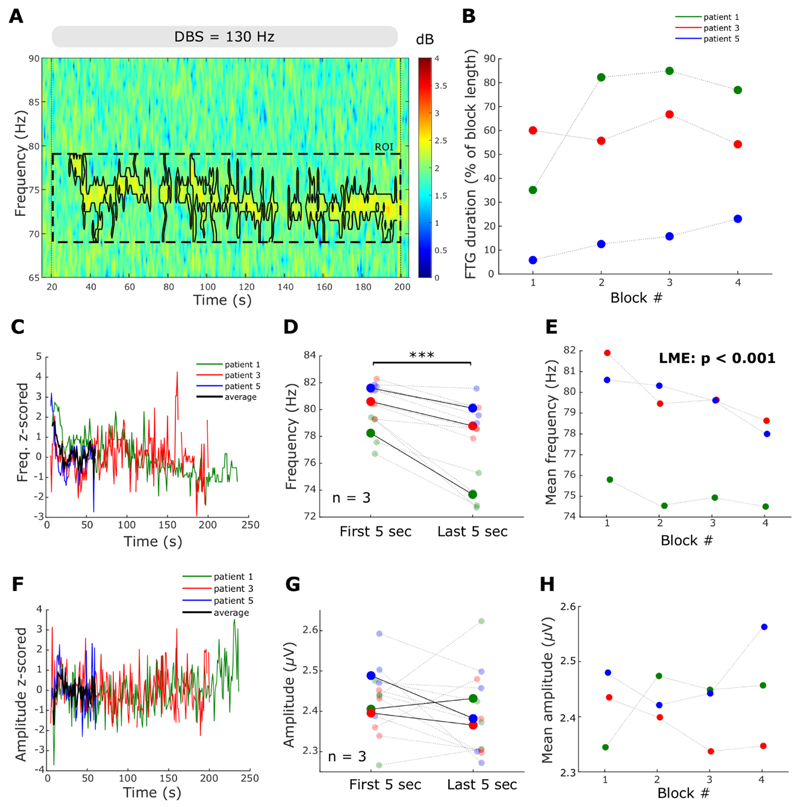
FTG dynamics during DBS blocks. A. Time-frequency spectrogram of a representative DBS block from patient 1. The grey bar and vertical dotted lines denote DBS onset and offset. The black contour surrounds power estimates above the 70th percentile of the ROI (see Methods). B. FTG durations during DBS in percentage of the total length of the stimulation block (linear mixed-effects model (LME): b = 5.89, t = 1.85, p = 0.09). C. FTG frequency during DBS over time averaged across blocks for each patient (data z-scored to frequencies during DBS; n = 3). Note the different FTG durations during DBS. Group average in black only given when data from all 3 patients was available. D. FTG frequency decreases between the first and last 5 s of a DBS block (LME: b = – 2.6, t = – 5.2, p < 0.001). Big dots denote averages of patients, small dots denote single blocks. Patients colour coded as in B. E. Mean FTG frequencies decreased across consecutive DBS blocks (LME: b = –0.72, t = – 4.7, p < 0.001). F. FTG amplitude during DBS over time (data z-scored to amplitudes during DBS; n = 3). G. FTG amplitude in the first and final 5 s of a DBS block (LME: b = – 0.02, t = – 0.7, p = 0.47). Big dots denote averages of patients, small dots denote single blocks. H. Average FTG amplitude does not change across consecutive DBS blocks (LME: b = 0.01, t = 0.6, p = 0.56).

