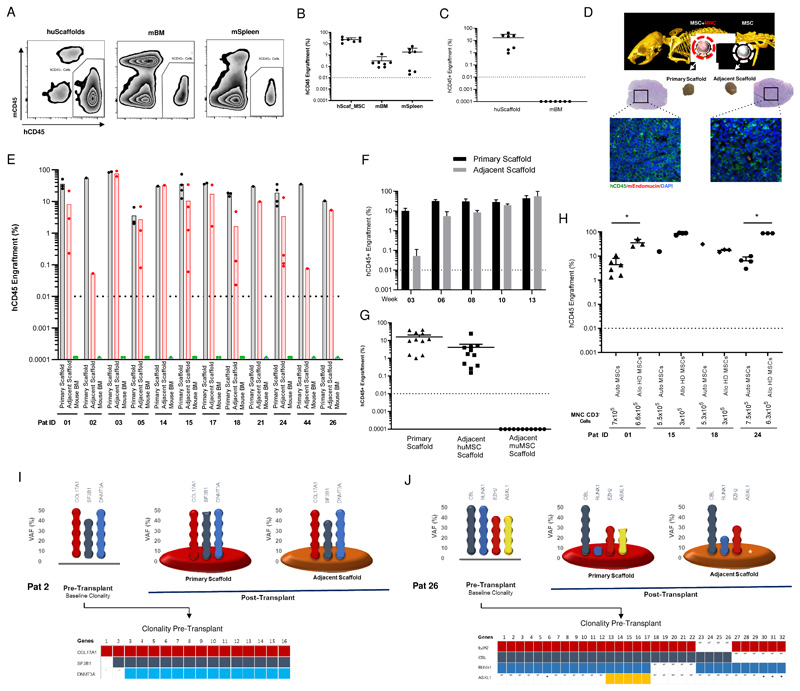
Figure 4. MDS HSPCs are highly dependent on the human MSC niche.
(A) Representative flow cytometry plot showing the engraftment of healthy hCD45+ cells in humanized niches, murine bone marrow and spleen in NSGW41 mice. (B) Percentage of healthy donor hCD45+ cells in humanized niche, murine bone marrow and murine spleen in NSGW41 and/or NSG-SGM3 mice. (C) Percentage of MDS hCD45+ cells in humanized scaffolds and murine bone marrow in NSGW41 mice. (D) Representative plot (Immunofluorescence and H&E staining) of the primary scaffold and adjacent scaffold after xenotransplantation in NSG-SGM3 mice. (E) Percentage of total hCD45+ cells in primary scaffold, adjacent scaffold and murine bone marrow after xenotransplantation in NSG-SGM3 mice. (F) In vivo migration kinetics of hCD45+ cells in the primary and adjacent scaffolds in NSG-SGM3 mice at various time points. (G) Percentage of MDS hCD45+ cells in humanized primary niche, adjacent niche with human MSCs and adjacent niche with murine MSCs in NSG-SGM3 mice. (H) Percentage of total hCD45+ cells in the humanized scaffolds that were seeded either with autologous MDS MSCs or allogenic healthy donor MSCs. (I, J) MDS patient clonal distribution in the primary pre-transplanted HSPCs, primary and adjacent scaffolds following the xenotransplantation. Bottom part of each figure shows the clonal spectrum at single cell level (single cell clonogenic assay) of primary day 0 pre-transplanted HSPCs for each patient. (A-H) Mice were injected with CD3- MNCs. huScaffold- humanized scaffold, mBM- Mouse bone marrow, mSpleen- Mouse Spleen. huMSC-human mesenchymal stromal cells, muMSC-Murine mesenchymal stromal cells. * P value <0.05.

