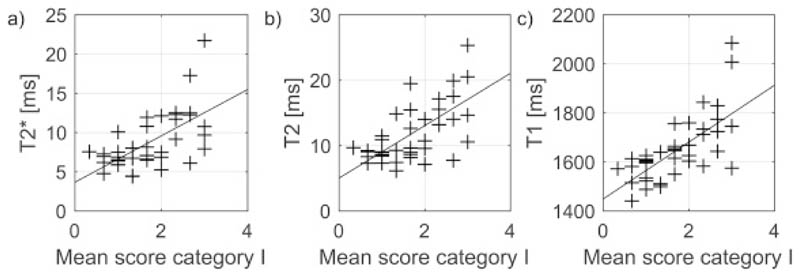
Fig. 4.
Mean relaxation times for each meniscus sample, as a function of histopathological score for category I (grading surface integrity) averaged over the sub categories for femoral, tibial and inner border surfaces. The lines represent the mixed effects linear model. Calculated regression coefficients are listed in Table 3.

