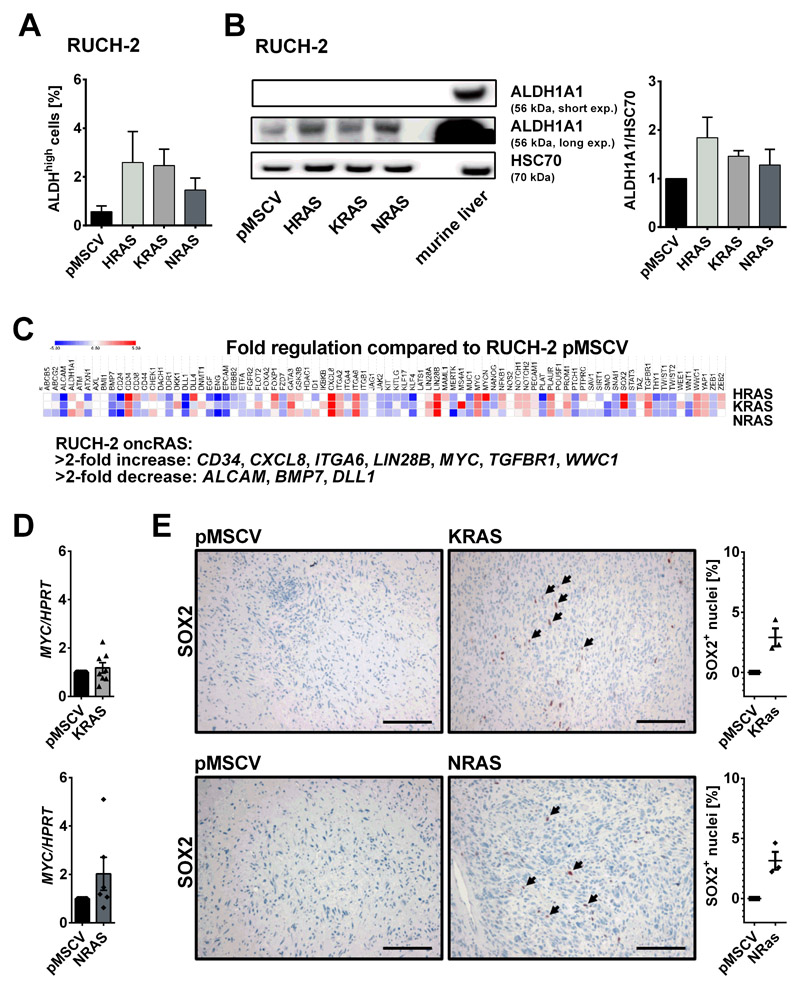
Figure 4. Impact of oncRAS on expression of stem cell markers in RUCH-2 cells.
A) Percentage of Aldefluorhigh (ALDHhigh) subpopulations of RUCH-2 cells stably expressing HRAS, KRAS, NRAS or pMSCV (n=3) measured by flow cytometry. B) Representative Western blot (n=2) (left) and corresponding densitometric analyses (right) of ALDH1A1 expression in HRAS-, KRAS- and NRAS-expressing RUCH-2 cells in comparison to RUCH-2 pMSCV control cells. Protein lysate of murine liver served as positive control. C) Mean fold regulation of 84 cancer stem cell associated genes in HRAS-, KRAS- and NRAS-expressing RUCH-2 cells compared to RUCH-2 pMSCV cells (n=2). D) MYC qRT-PCR analyses and E) anti-SOX2 antibody stainings and percentage of SOX2+ nuclei of KRAS and NRAS-expressing RUCH-2 xenotransplants (n=8 or n=3 for MYC qRT-PCR or SOX2 stainings, respectively) compared to respective pMSCV control tumors of the same mice (set to 1 for MYC qRT-PCR). Bars in A and D: mean + SEM. Scale bars: 100 μm. Arrows: SOX2+ nuclei.

