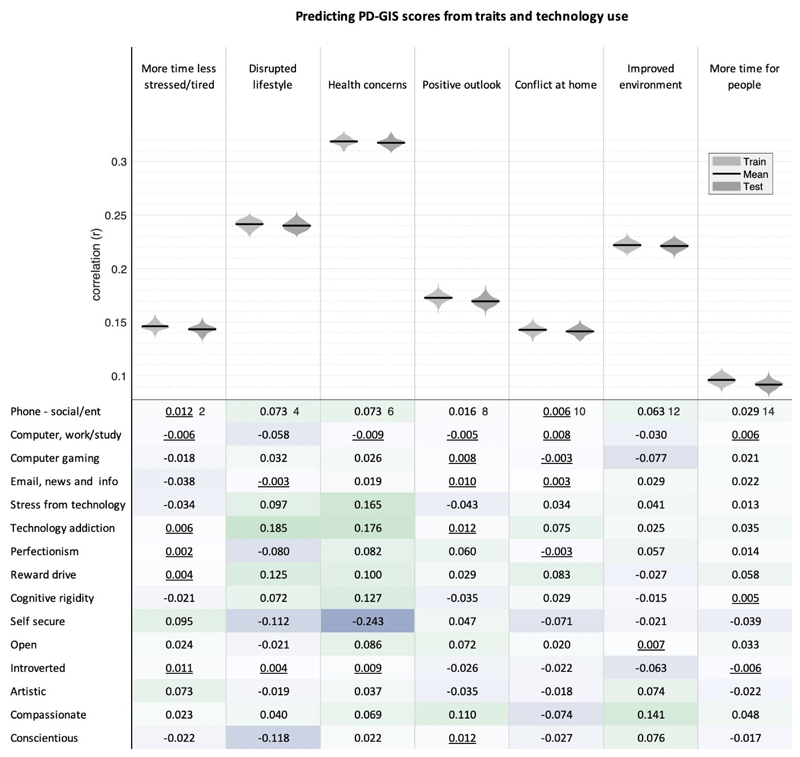
Figure 10. Correlation of Trait and Technology with PD-GIS component scores.
Top. Linear modelling showed that collectively emotion, compulsivity and technology-use traits predict substantial variance (all p<0.0001 two tailed and FWE corrected for multiple comparisons) in dimensions of self-perceived pandemic impact, particularly for health concerns. Violin plots show the distributions of Pearson’s correlations for 100 models trained on random 50% subsets of the data (light grey) and the correlations of predicted vs observed values when those trained models were applied to the remaining 50% of the data (dark grey), to which it was naïve, with means highlighted in black. Note the lack of overfit. Bottom. Bivariate correlations were mostly statistically significant and generally in the small range. Non-significant correlations at the two-tailed criterion of p>0.05 after FWE correction for multiple comparisons are underlined. The strongest relationships were evident for (i) disrupted lifestyle, which correlated positively with technology addiction and reward drive, and negatively with self-security and conscientiousness; and (ii) health concerns, which correlated positively with stress from technology, technology addiction, reward drive and cognitive rigidity, and negatively with self-security. Source data are provided as a Source Data file.

