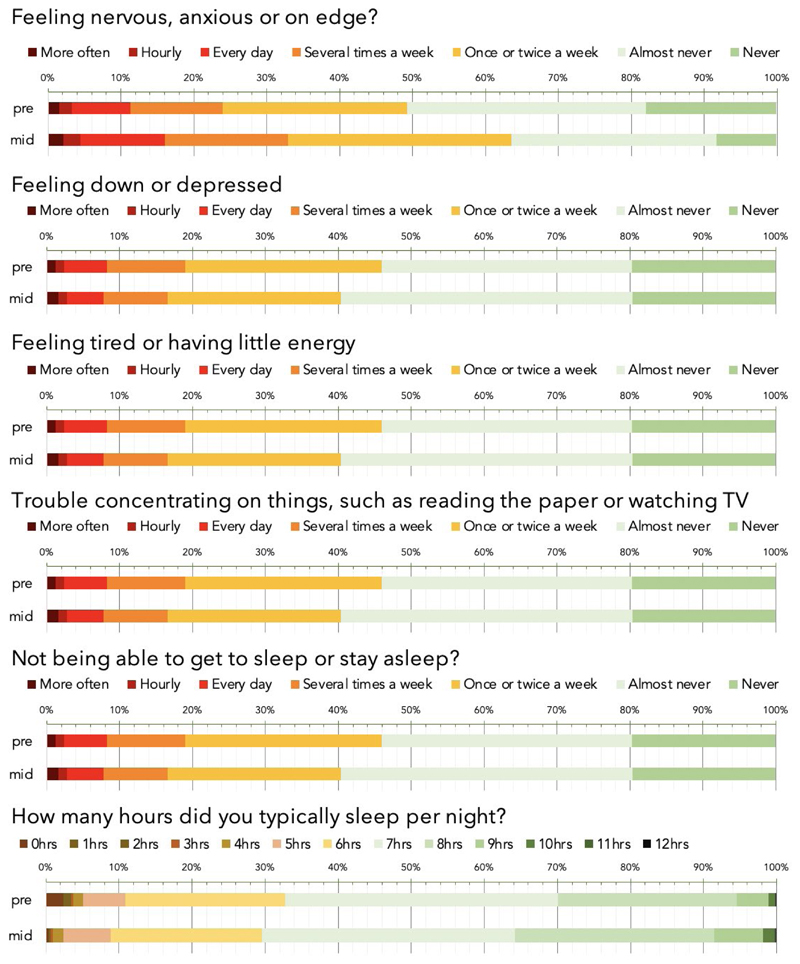
Figure 2. Visual comparison of mental health and sleep measures during the Pre-UK Pandemic and Mid-UK Lockdown epochs.
Symptoms of mood and sleep problems, as quantified using standard mood self-assessment items, in the population for pre-pandemic (pre) and mid-Pandemic (mid). Bars in the top five plots represent the percentage of respondents reporting symptoms at different frequencies over recent weeks. The lower plot percentage for typical number of hours slept. On average, anxiety levels were higher, people were sleeping more, whereas other mood symptoms were marginally lower. Source data are provided as a Source Data file.

