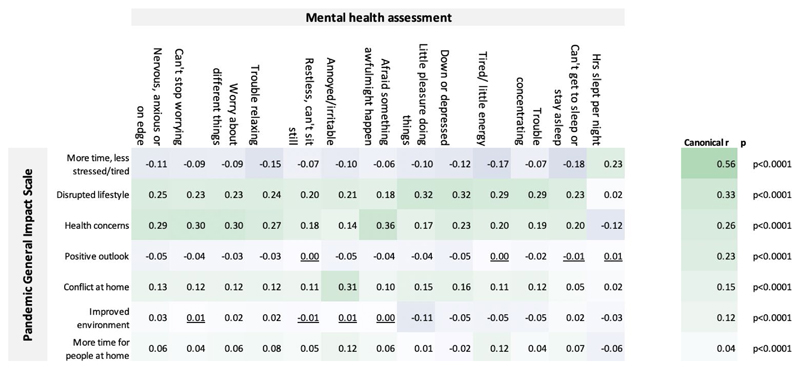
Figure 5. Interrelationships between the PD-GIS sub-scales and mental health assessment.
Top left. Pearson’s bivariate correlation r values. Only a few correlations were statistically non-significant at p<0.05 two tailed and FWE corrected for multiple comparisons (underlined). Significant correlations were evident between measures of self-perceived COVID-19 pandemic impact, as captured in the PD-GIS sub-scales, and the mood self-assessment items. Top right. Canonical correlation analysis confirmed this relationship in a multivariate manner, with 7 statistically significant correlation modes as evaluated using Bartlett’s approximate chi-squared statistic for H(k)0 with Lawley’s modification, the largest with canonical r=0.56 and the last mode significant at p=6.5e-26. These results show that the effects of the pandemic on daily life have a significant component in explaining individual differences in standard mental health assessment measures. Source data are provided as a Source Data file.

