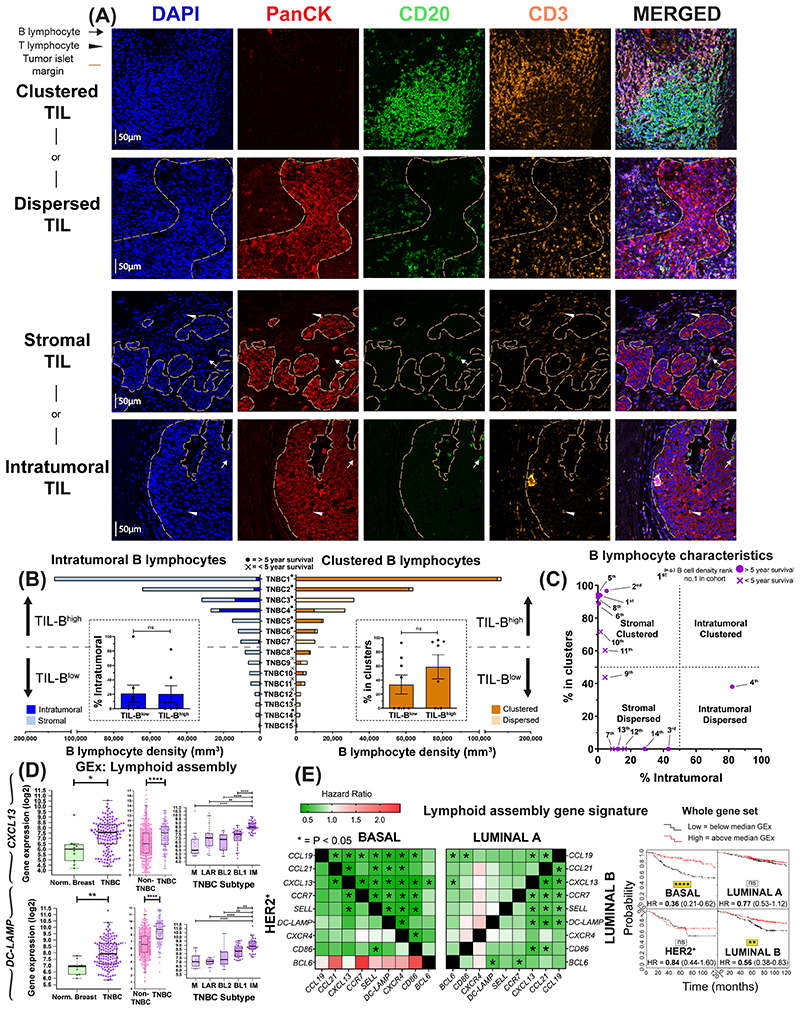
Figure 3. Occurrence of B lymphocytes in stromal clusters.
(A) Representative IHC/IF images (Bart’s IHC cohort), highlighting key TIL characteristics: clustered TIL versus dispersed TIL and stromal TIL (outside tumor nests) vs intratumoral TIL (within tumor nests). Scale bar=50μm. (B) Quantitative assessment of TIL-B spatial and structural characteristics within TNBC (N=15): [left] intratumoral vs stromal; [right] clustered versus non-clustered. Patients ranked according to CD20+ TIL-B density (TNBC1=highest), and overall survival data indicated. [Inset] Patients samples split at median density into high and low TIL-B groups and the % of intratumoral (left) or clustered (right) B lymphocytes were analyzed. Statistical significance was determined using Student’s t-test. (C) Characterization of TNBC TIL-B profile as stromal clustered, intratumoral clustered, stromal dispersed, or intratumoral dispersed. Overall survival data are indicated. (D) GEx data for lymphoid assembly marker genes CXCL13 and DC-LAMP ([left] normal breast vs TNBC (N=10 vs 131, KCL GEx cohort); non-TNBC vs TNBC ([middle] N=515 vs 123, TCGA GEx cohort); TNBC subtypes ([right] N=122, KCL GEx cohort). (E) Survival analysis in KM Plotter of determined ER- HER2-/basal surrogate, HER2+, luminal A, luminal B subtype KM plotter surrogate subgroups (19) (KM plotter cohort). These indicate that expression of lymphoid cell assembly genes carries positive prognostic value in TNBC/basal-like and luminal B subtype ([left] Individual genes were evaluated in combination with each other gene, and [right] gene set as a whole).

