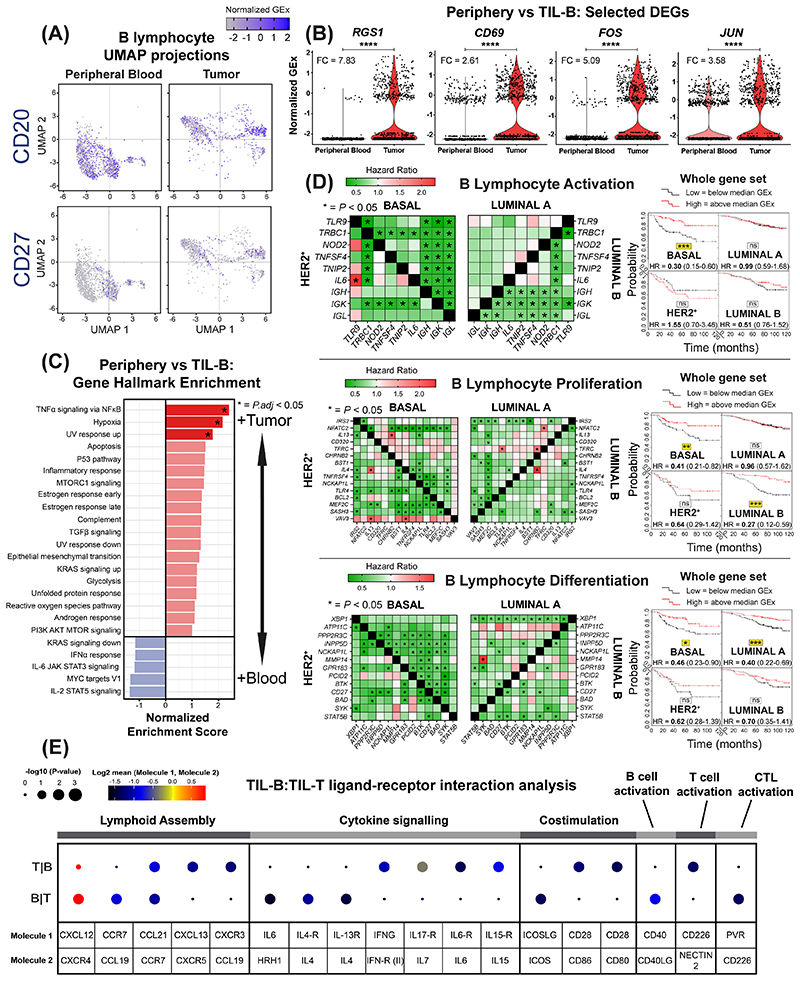
Figure 4. scRNA-seq analysis reveals BCR-driven TIL-B activatory signatures and B lymphocyte lineage gene markers predict positive survival outcome.
(A) UMAP visualization according to global GEx of single B lymphocytes pooled from the peripheral blood (1,476 cells) and tumors (1,021 cells) of eight patients (Single cell cohort), colored by relative normalized gene expression levels for CD20 and CD27. (B) The detection of differentially expressed genes (DEGs, on cells originally annotated by Azizi et al. (22) as B cells) demonstrates elevated expression of FOS, JUN, RGS1 and CD69, indicated by fold change (FC) (determined using Wilcoxon Rank Sum test). (C) Gene set enrichment analysis of TIL-B relative to circulating B lymphocytes using hallmark gene sets. Red color indicates significant upregulation of normalized enrichment scores in TIL-B. (D) Survival analysis in KM Plotter of determined ER-HER2-/basal surrogate, HER2+, luminal A, luminal B subtype KM plotter surrogate subgroups (19) (KM plotter cohort) for expression of gene signatures positively regulating key B lymphocyte properties (activation, proliferation and differentiation). Representative genes listed for B lymphocyte proliferation (44 total in set). Signatures from all three functions carry positive prognostic value in the basal-like cancer subtype ([left] Individual genes were evaluated in combination with each other gene, and [right] gene set as a whole). (E) CellPhoneDB (25) was applied to analyze B cell-T cell interactions (Single cell cohort). After false discovery rate (FDR<0.001) correction, communication pathways identified included lymphoid assembly, cytokine signaling, co-stimulation, T-cell dependent B cell activation, and cytotoxic T lymphocyte (CTL) activation. Circle sizes indicate p-value while color-coding represents the average expression level of interacting molecule 1 in cluster 1 and interacting molecule 2 in cluster 2.

