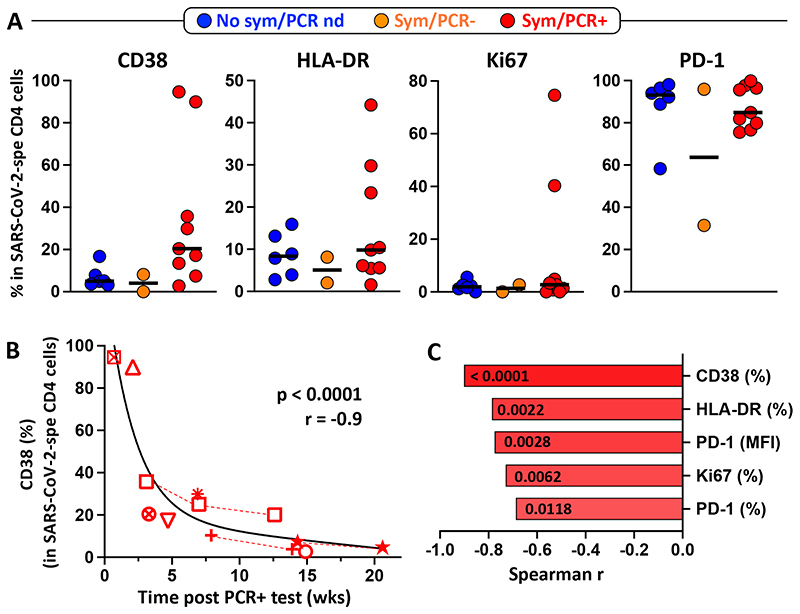
Figure 6. Activation profile of SARS-CoV-2-specific CD4 T cells.
A- CD38, HLA-DR, Ki67 and PD-1 expression in SARS-CoV-2-specific CD4 T cells in each group (Blue: no symptoms, no SARS-CoV-2 PCR performed; Orange: self-reported symptoms, SARS-CoV-2 PCR negative and Red: self-reported symptoms, SARS-CoV-2 PCR positive). No significant differences were observed between groups for any markers, using the Kruskal-Wallis test. B- Association between CD38 expression in SARS-CoV-2-specific CD4 T cells and the time post SARS-CoV-2 PCR positive test (weeks). Each symbol represents a participant (n=9). Dotted red lines identify participant with longitudinal samples. Correlations were tested by a two-tailed non-parametric Spearman rank test. C- Comparison of the correlation between the time post SARS-CoV-2 PCR positive test (weeks) and the expression of different activation profile markers, ranked according to the strength of the association. Spearman correlation r values are plotted on the x-axis and corresponding P-values are shown within each bar.

