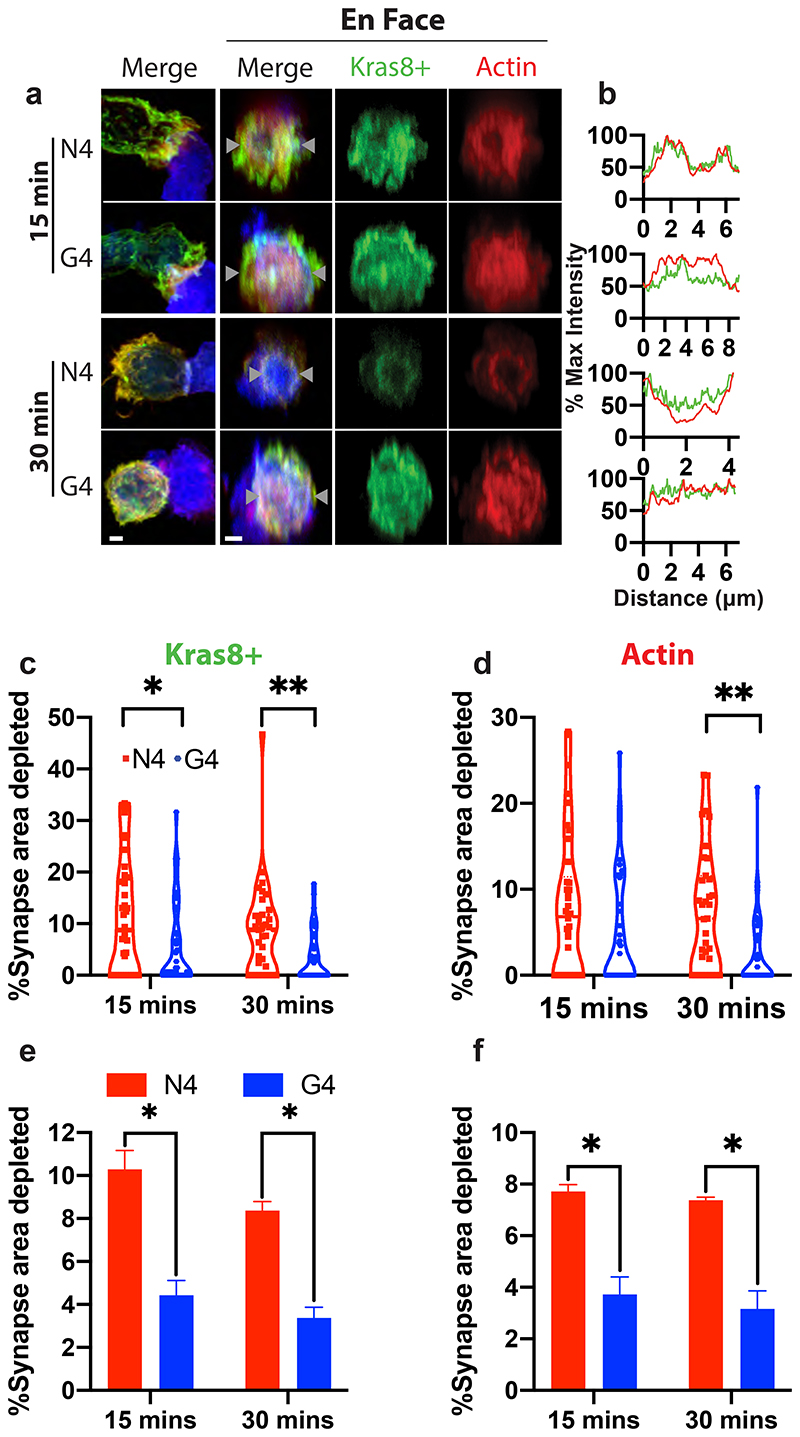
Figure 2. Increasing TCR signal strength increases actin depletion.
Confocal projections showing cell conjugates or 3μm depth en face reconstructions across the synapse for OTI CTL expressing Kras8+ probe (green) conjugated with N4 or G4 presenting EL4 for times as shown prior to fixation and labelling for actin (red). (a) Representative images of conjugates showing actin (red), Kras8+ in (green), and EL4 (blue). Maximum intensity projections (left), and en face projections (right) for merged, actin and Kras8+ signals. Scale bars = 1μm. (b) Intensity profiles for actin and Kras8+ along line marked between grey triangles. (c,e) Area of synapse depleted for Kras8+ expressed as a percentage of the total synapse area taken from the en face images for (c) each individual cell in one representative experiment (n=30 per condition), (e) the mean, bars show SEM from 3 separate repeats. (d,f) Area of synapse depleted for actin as a percentage of the total synapse area taken from the en face images for (d) each individual cell in one representative experiment (n=30 per condition), (f) the mean, bars show SEM from 3 separate repeats. A two-tailed Bonferroni corrected Mann-Whitney test was used for statistical analysis of (c-f) with *=p<0.5 and **=p<0.01.

