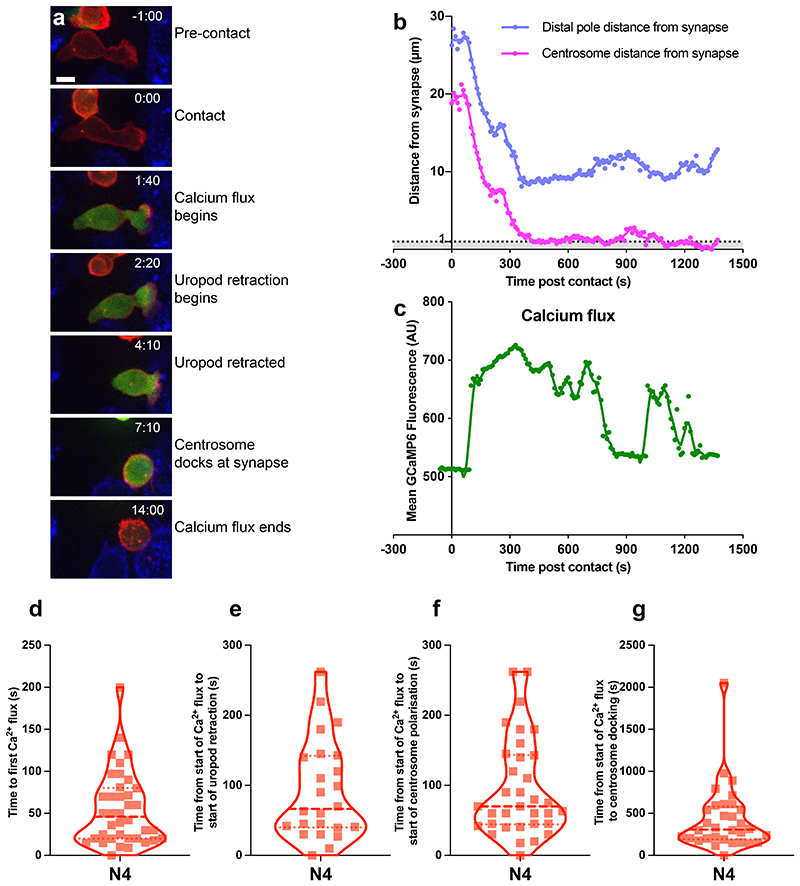
Figure 5. Calcium flux precedes centrosome polarisation and uropod retraction.
OTI CTL expressing GCAMP6m (green), Lifeact-mApple (red) and RFP-PACT (red sphere) interacting with EL4 (blue), pulsed with N4. (a-b) Representative max-intensity projection timeseries of OTI CTL encountering N4 pulsed target. Scale bars = 5μm, time min:sec post contact with target. (b-c) Example cell from (a) segmented with Imaris to measure: (b) the distance of the distal pole (blue) and centrosome (red) to the synapse. (c) The mean GCaMP6m fluorescence within the CTL. (d-g) Violin plots of (d) time from contact to first calcium flux, n=38, the time from the start of the calcium flux to; (e) start of uropod retraction (n=24), (f) start of centrosome polarisation toward synapse (n=34), (g) centrosome docking at the synapse (n=32).

