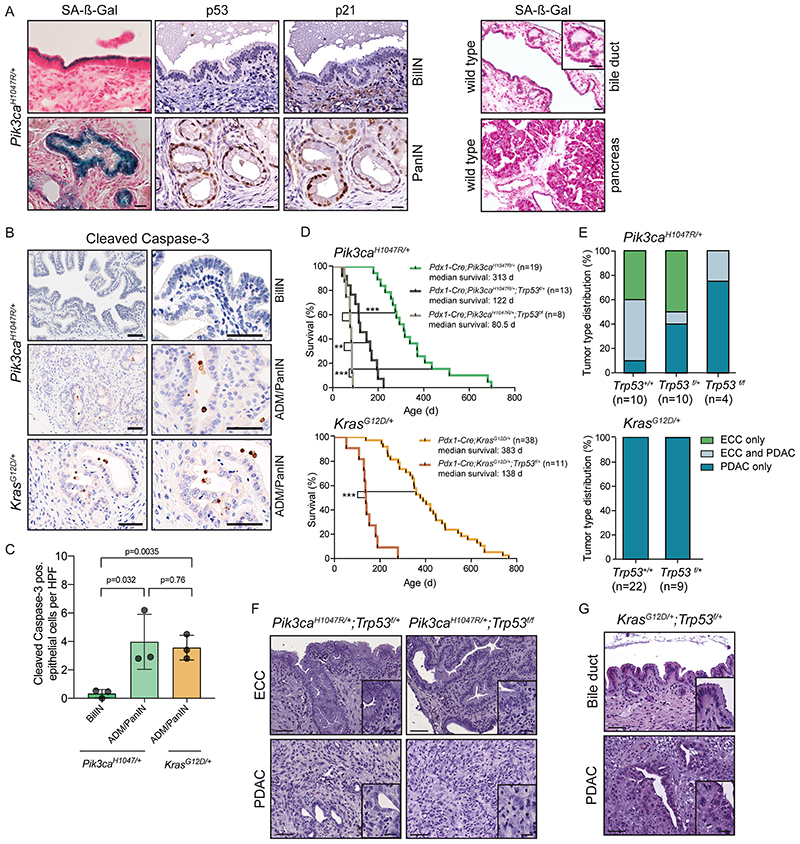
Figure 3. Oncogenic PI3K signaling induces senescence in the extrahepatic bile duct that is independent of the Trp53 pathway.
(A) Left panel: Representative senescence associated β-galactosidase (SA-β-Gal) staining, and Trp53 and p21 immunohistochemistry of BilIN (upper panel) and PanIN (lower panel) lesions of Pdx1-Cre;Pik3caH1047R/+ mouse. Right panel: Representative SA-β-Gal staining of wildtype extrahepatic bile duct and pancreas. Scale bars, 20 μm. (B) Representative immunohistochemical cleaved caspase 3 staining of BilIN and ADM/PanIN of Pdx1-Cre;LSL-Pik3caH1047R/+ mouse and ADM/PanIN of Pdx1-Cre;LSL-KrasG12D/+ mouse. Scale bars, 50 μm. (C) Quantification of cleaved caspase 3 positive epithelial cells in BilIN and ADM/PanIN lesions of the indicated genotypes. Each dot represents one animal (mean ± s.d.; p values are indicated, two-tailed Student’s t-test). (D) Kaplan-Meier survival curves of the indicated genotypes (** p<0.01; *** p<0.001, log rank test). (E) Upper panel: Tumor type distribution according to histological analysis of the extrahepatic bile duct and pancreas of Pdx1-Cre;LSL-Pik3caH1047R/+ , Pdx1-Cre;LSL-Pik3caH1047R/+;p53f/+ and Pdx1-Cre;LSL-Pik3caH1047R/+;p53f/f mice. Note: Reduced ECC fraction in mice with the Pdx1-Cre;Pik3caH1047R/+;p53f/f genotype (p=0.02, Fisher’s exact test). Lower panel: Tumor type distribution according to histological analysis of the extrahepatic bile duct and pancreas of Pdx1-Cre;LSL-KrasG12D/+ and Pdx1-Cre;LSL-KrasG12D/+;p53f/+ mice. (F) Representative H&E staining of ECC and PDAC of Pdx1-Cre;LSL-Pik3caH1047R/+;p53f/+ and Pdx1-Cre;LSL-Pik3caH1047R/+;p53f/f mice. (G) Representative H&E staining of the common bile duct and PDAC of Pdx1-Cre;LSL-KrasG12D/+;p53f/+ mouse. Scale bars, 50 μm for micrographs and 20 μm for insets. Note: The Pdx1-Cre;Pik3caH1047R/+ and Pdx1-Cre;LSL-KrasG12D/+ cohorts shown in panel D and E are the same as shown in Fig. 2C and D.

