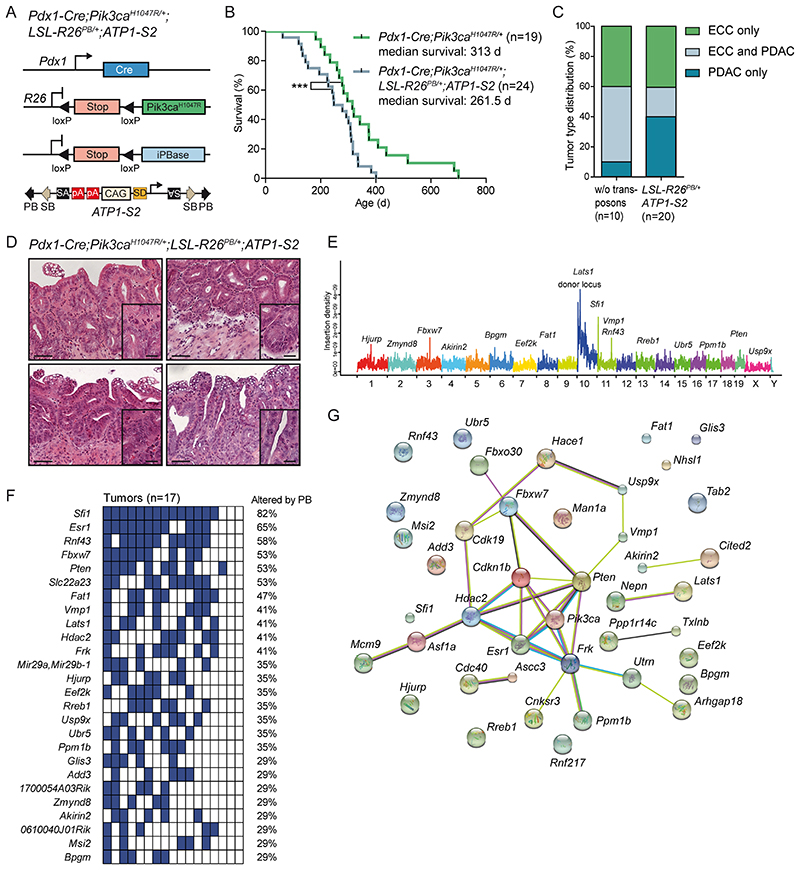
Figure 4. Identification of cancer genes in the extrahepatic biliary tract by a piggyBac transposon mutagenesis screen.
(A) Genetic strategy used to activate ATP-S2 transposons by the piggyBac (PB) transposase in a Pdx1-Cre;LSL-Pik3caH1047R/+ mutant background. pA, poly adenylation site; SA, splice acceptor; SD, splice donor; iPBase, insect version of the piggyBac transposase; CAG, CAG promoter. The ATP1-S2 mouse line carries 20 copies of the transposon construct on chromosome 10, which can be mobilized by the piggyBac transposase. Unidirectional integration of the transposon can lead to gene activation through its CAG promoter. Gene inactivation is independent of transposon orientation. (B) Kaplan-Meier survival curves of the indicated genotypes (*** p<0.001, log rank test). Note: The Pdx1-Cre;Pik3caH1047R/+ cohort is the same as shown in Fig. 2C. (C) Tumor type distribution according to histological analysis of the extrahepatic bile duct and pancreas from Pdx1-Cre;LSL-Pik3caH1047R/+ and Pdx1-Cre;LSL-Pik3caH1047R/+;LSL-R26PB;ATP1-S2 mice. (D) Representative H&E stainings of four individual piggyBac- induced ECC of Pdx1-Cre;LSL-Pik3caH1047R/+;LSL-R26PB;ATP1-S2 mice. Scale bars, 50 μm for micrographs and 20 μm for insets. (E) Genome-wide representation of transposon insertion densities in ECCs (pooled data from 17 tumors). Selected common insertion site (CIS) genes are depicted. Chromosomes are labeled by different colors and chromosome number is indicated on the x-axis. The transposon donor locus is on chromosome 10. (F) Co-occurrence analysis of the CIS identified by TAPDANCE analysis in 17 tumors. Each column represents one tumor where insertions in the respective genes are indicated in blue. The fraction of tumors carrying an insertion in the respective genes is given as percentage. (G) Network of protein interactions between CIS genes generated by STRING analysis (38). Each network node represents one protein. Interactions are marked by lines in different colors (green, neighborhood evidence; purple, experimental evidence; light blue, database evidence; black, co-expression evidence). Cdkn1b, p27Kip1.

