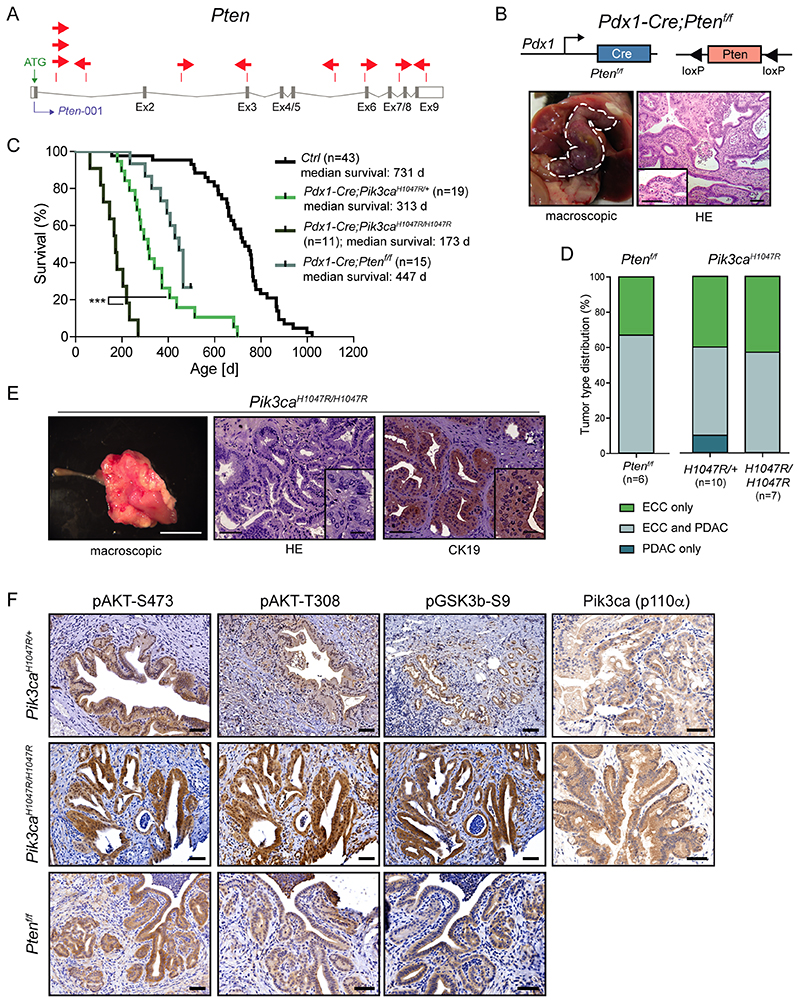
Figure 5. Functional validation of transposon integrations: PI3K signaling output is a critical determinant of ECC development.
(A) piggyBac insertion patterns in Pten. Pten possesses one protein-coding isoform consisting of 9 exons. Each arrow represents one insertion and indicates the orientation of the CAG promoter that was introduced into the transposon. (B) Upper panel: Genetic strategy used to inactivate Pten in the Pdx1 linage using a Pdx1-Cre line. Lower panel: Representative macroscopic picture (left, bile duct depicted by a white dashed line) and H&E stained tissue section (right) of an ECC from a Pdx1-Cre;Ptenf/f mouse. Scale bars, 50 μm for micrographs and 50 μm for insets. (C) Kaplan-Meier survival curves of the indicated genotypes (*** p<0.001, log rank test). Note: The Pdx1-Cre;Pik3caH1047R/+ and the control cohort is the same as shown in Fig. 2C. (D) Tumor type distribution according to histological analysis of the bile duct and pancreas from Pdx1-Cre;Ptenf/f, Pdx1-Cre;LSL-Pik3caH1047R/+ and Pdx1-Cre;LSL-Pik3caH1047R/H1047R mice. Note: The Pdx1-Cre;Pik3caH1047R/+ cohort is the same as shown in Fig. 2D. (E) Left panel: Representative macroscopic picture of an ECC from a Pdx1-Cre;LSL-Pik3caH1047R/H1047R mouse. Scale bar, 1 cm. Middle and right panel: Representative H&E (middle) and immunohistochemical CK19 (right) stained tissue section of an ECC from a Pdx1-Cre;Pik3caH1047R/H1047R mouse. Scale bars, 50 μm for micrographs and 20 μm for insets. (F) Representative H&E stainings and immunohistochemical analyses of PI3K/AKT pathway activation and Pik3ca (p110α) expression in the common bile duct of Pdx1-Cre;LSL-Pik3caH1047R/+ , Pdx1-Cre;LSL-Pik3caH1047R/H1047R and Pdx1-Cre;Ptenf/f mice. Scale bars, 50 μm.

