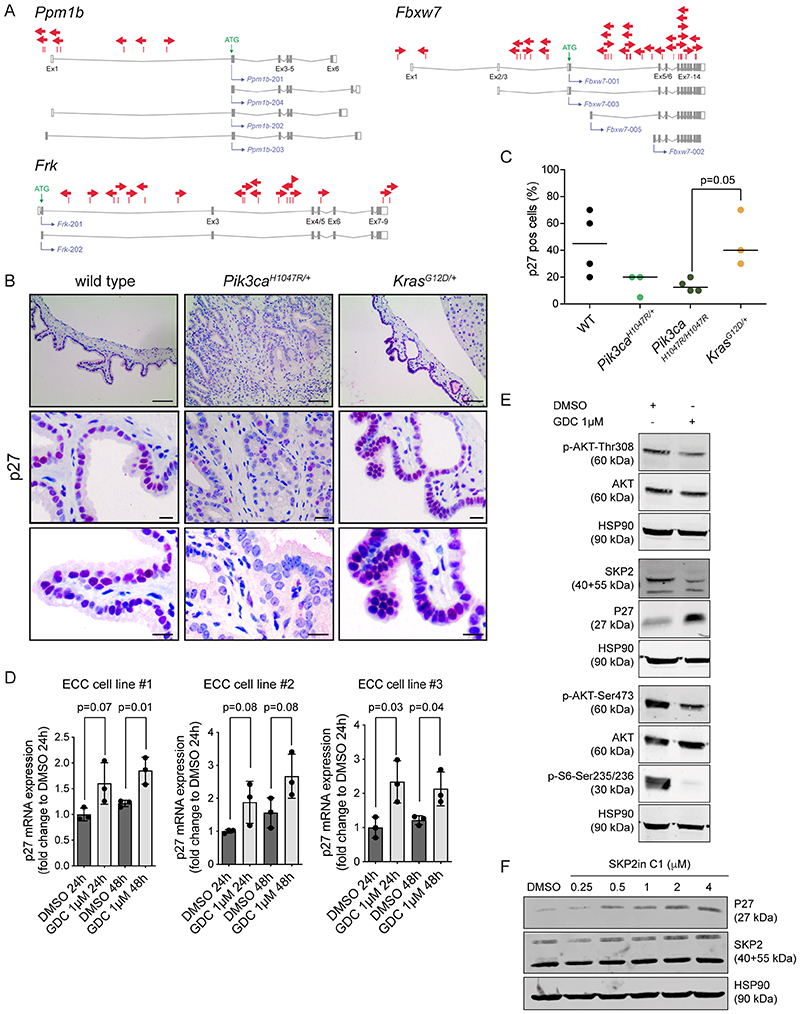
Figure 6. p27Kip1 (Cdkn1b) expression is downregulated by mutant PIK3CAH1047R.
(A) piggyBac insertion patterns for selected CIS genes implicated in p27Kip1 (Cdkn1b) regulation. Ppmb1b and Fbxw7 possess four protein-coding transcripts. Frk has two protein-coding isoforms consisting of 8 and 9 exons. Each arrow represents one insertion and indicates the orientation of the CAG promoter that was introduced into the transposon. (B) Representative immunohistochemical analysis of p27Kip1 expression in the common bile duct of 6 months old wildtype, Pdx1-Cre;LSL-Pik3caH1047R/+ and Pdx1-Cre;LSL-KrasG12D/+ mice. Scale bars, 80 μm (upper panel), 20 μm (middle panel and lower panel). Note: IHC staining was performed using 3-amino-9-ethylcarbazole (AEC) as chromogen resulting in a pink color of positively stained cells. (C) Quantification of p27Kip1 positive bile duct epithelial cells in 6-months-old wildtype, Pdx1-Cre;LSL-Pik3caH1047R/+, Pdx1-Cre;LSL-Pik3caH1047R/H1047R and Pdx1-Cre;LSL-KrasG12D/+ mice (n=3-4 animals per genotype). Each dot represents one animal; the horizontal line represents the mean. (p=0.05, Pdx1-Cre;LSL-Pik3caH1047R/H1047R vs. Pdx1-Cre;LSL-KrasG12D/+; Wilcoxon Rank Sum test). (D) qRT-PCR analysis of p27Kip1 mRNA expression in three primary murine ECC cell lines from Pdx1-Cre;LSL-Pik3caH1047R/+ mice treated with either vehicle (DMSO) or 1μM GDC-0941 for 24 or 48 hours as indicated. Data are shown as fold-change to DMSO treatment (n=3; mean + s.d.; p values are indicated, Student’s t-test). (E) Immunoblot analysis of PI3K/AKT pathway activation and p27Kip1 expression in primary murine ECC cell line #1 treated with either vehicle (DMSO) or 1μM GDC-0941 for 48 h. Hsp90α/β was used as loading control. (F) Immunoblot analysis of p27Kip1 expression in primary murine ECC cell line #1 treated with either vehicle (DMSO) or the indicated concentrations of the SKP2 inhibitor SKP2in C1 for 48 h. Hsp90α/β was used as loading control.

