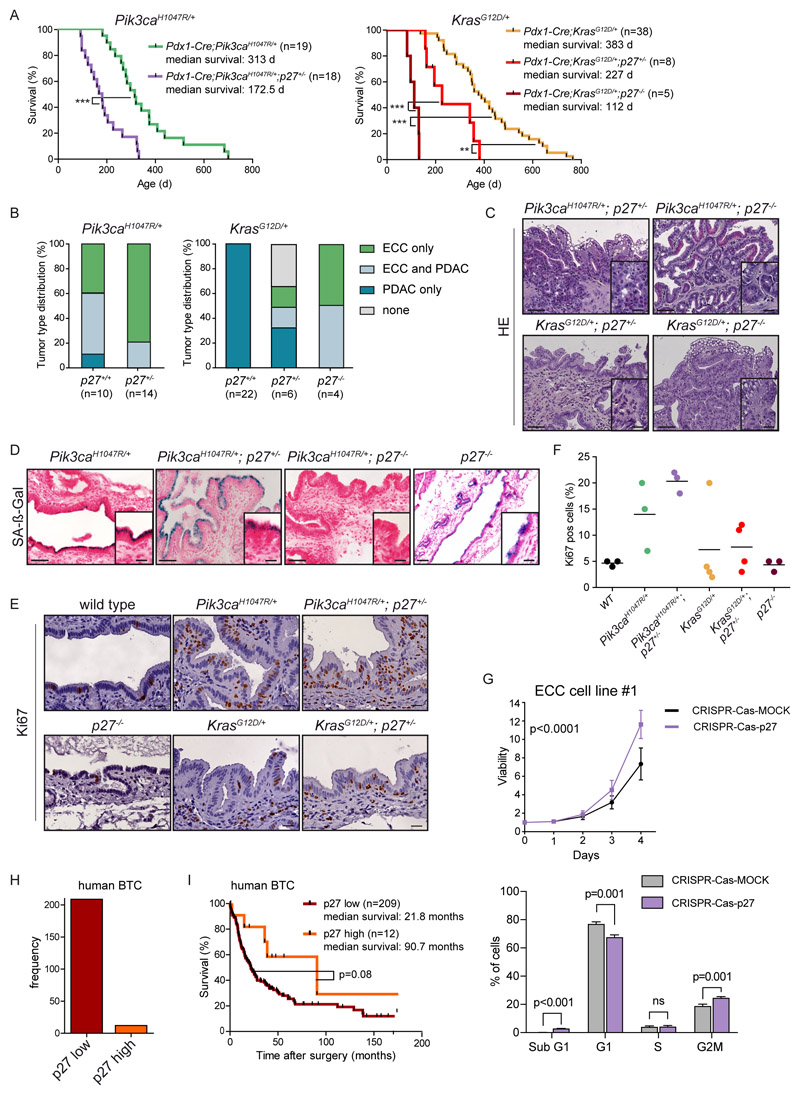
Figure 7. p27Kip1 is a context-specific roadblock for Kras-induced ECC formation.
(A) Kaplan-Meier survival curves of the indicated genotypes (*** p<0.001, ** p<0.01, log rank test). (B) Tumor type distribution according to histological analysis of the extrahepatic bile duct and pancreas from Pdx1-Cre;LSL-Pik3caH1047R/+ and Pdx1-Cre;LSL-Pik3caH1047R/+;p27+/- mice (left panel) and Pdx1-Cre;LSL-KrasG12D/+, Pdx1-Cre;LSL-KrasG12D/+;p27+/- and Pdx1-Cre;LSL-KrasG12D/+;p27-/- animals (right panel). Note: Significant increase of ECC development in mice with the Pdx1-Cre;LSL-KrasG12D/+;p27-/- genotype (p<0.0001, Fisher’s exact test). (C) Representative H&E staining of the common bile duct of aged Pdx1-Cre;LSL-Pik3caH1047P/+;p27+/- , Pdx1-Cre;LSL-Pik3caH1047R/+;p27-/-, Pdx1-Cre;LSL-KrasG12D/+;p27+/- and Pdx1-Cre;LSL-KrasG12D/+;p27-/- mice. (D) Representative senescence associated β-galactosidase (SA-β-Gal) staining of the common bile duct of Pdx1-Cre;LSL-Pik3caH1047R/+ , Pdx1-Cre;LSL-Pik3caH1047R/+;p27+/-, Pdx1-Cre;LSL-Pik3caH1047P/+;p27-/- and p27-/- mice. C and D: Scale bars, 50 μm for micrographs and 20 μm for insets. (E) Representative images of Ki67 stained common bile duct tissue sections of 3-month-old wildtype (control), Pdx1-Cre;LSL-Pik3caH1047R/+, Pdx1-Cre;LSL-Pik3caH1047P/+;p27+/-, p27-/-, Pdx1-Cre;LSL-KrasG12D/+ and Pdx1-Cre;LSL-KrasG12D/+;p27+/- mice. Scale bars, 20 μm. (F) Quantification of Ki67 positive biliary epithelial cells of indicated genotypes. Each dot represents one animal, the horizontal line the mean. (G) Upper panel: Viability assay of primary murine ECC cell line #1 from Pdx1-Cre;LSL-Pik3caH1047R/+ mouse after CRISPR-Cas9 mediated deletion of p27Kip1 (Cdkn1b). Cells were transfected with either Cas9-sgRNA-p27Kip1 targeting Cdkn1b (CRISPR-Cas-p27) or a MOCK Cas9-sgRNA-MOCK vector, selected using puromycin, and cell viability was measured in triplicate using MTT assay (n=4 independent experiments, mean ± s.d., p<0.0001, 2-way ANOVA). Lower panel: FACS based cell cycle analysis of the cells shown in the upper panel. The p values were determined with multiple t tests and Benjamini correction and are shown in the figure; n.s., not significant. (H) Quantification of p27Kip1 expression by immunohistochemistry of 221 surgically resected human biliary tract cancer (BTC) specimens. (I) Kaplan-Meier survival curves of BTC patients with low or high p27Kip1 protein abundance (p=0.08; log rank test). Note: The Pdx1-Cre;Pik3caH1047R/+ and Pdx1-Cre;LSL-KrasG12D/+ cohorts shown in panel A and B are the same as shown in Fig. 2C and D.

