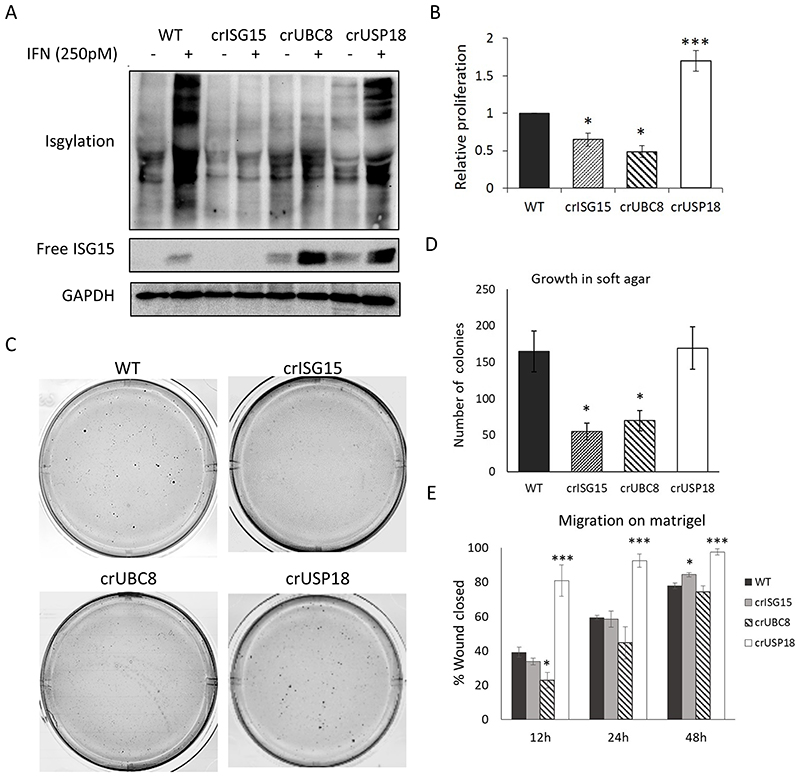
Fig. 2. ISGylation correlates with an aggressive phenotype in MDA-MB-231-luc-D3H2LN.
(A) WB analysis of free ISG15 and ISGylation levels in WT cells and the different representative clones, treated for 48h with either vehicle or IFNb1a 250 pM. (B) Proliferation assay performed in the indicated clones. Equal amounts of cells were seeded and then counted manually. Bar graph shows the relative increase in cell number during 72h ± S.E.M. n=4. (C) Representative images of soft agar experiments. Equal cell numbers of the indicated, representative clones were seeded embedded in soft agar and after 28 days stained with crystal violet; n=4. Images are displayed in grayscale for better identification of the colonies. (D) Quantification of number of colonies identified in the soft agar assay. Bar graph shows average ± S.E.M. (E) Relative migration. Equal amounts of cells were seeded into Matrigel-coated wells where scratch wounds were used to determine cell motility, photos were taken every 3h for up to 48h and motility was measured as percentage of wound closed per time point. Bar graph shows the average migration of the different clones versus WT cells at 12, 24 and 48h, ±S.E.M; n=3. p-value < 0.05 (*), p-value < 0.005 (***).

