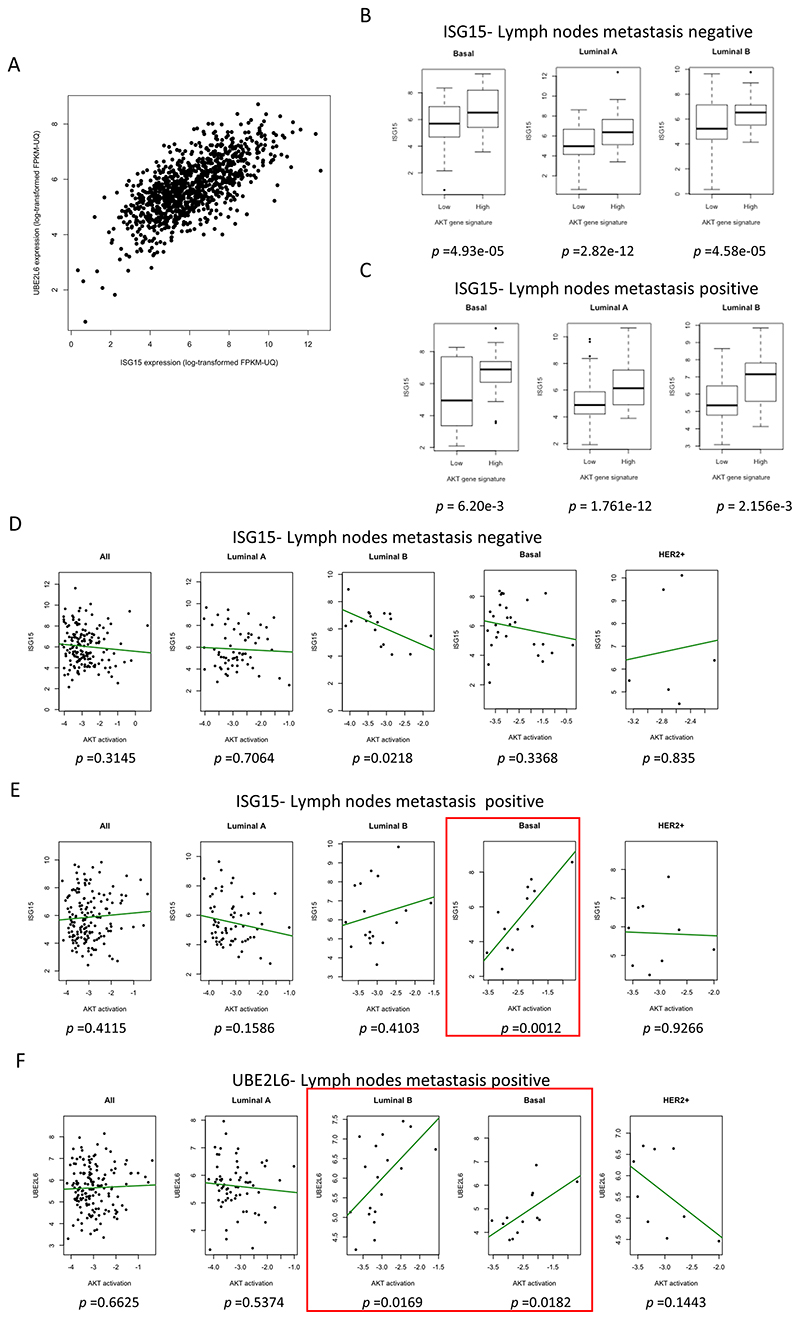
Fig. 7. ISG15 correlates positively with Akt activation in breast cancers.
(A) Correlation analysis of ISG15 and UBE2L6 mRNA expression levels in breast cancer samples. The spearman’s correlation is 0.66, p-value < 2.2e-16 (B) Boxplots showing the correlation between an Akt-activity gene-signature and ISG15 mRNA in in lymph node negative basal breast cancer (n=68), luminal A (n=174), and luminal B (n=41). p-values are displayed below each graph. (C) Boxplots showing the correlation between an Akt-activity gene-signature and ISG15 mRNA in in lymph positive basal breast cancer (n=36), luminal A (n=188) and luminal B (n=53). p-values are displayed below each graph. (D) Correlation between pAkt and ISG15 mRNA levels in tumours without lymph node metastasis as a whole (n=166) or classified by subtype; luminal A (n=62), luminal B (n=17), basal (n=28) and HER2 (n=6). (E) Correlation as in D in tumours positive for lymph node metastasis as a whole (n=156) or classified by subtype: Luminal A (n=65), Luminal B (n=18), Basal (n=13) and HER2+ (n=9). (F) As (B) for UBE2L6 mRNA expression. In red boxes, tumour subtypes that showed a statistically significant correlation between pAkt and ISG15 or UBE2L6 mRNA.

