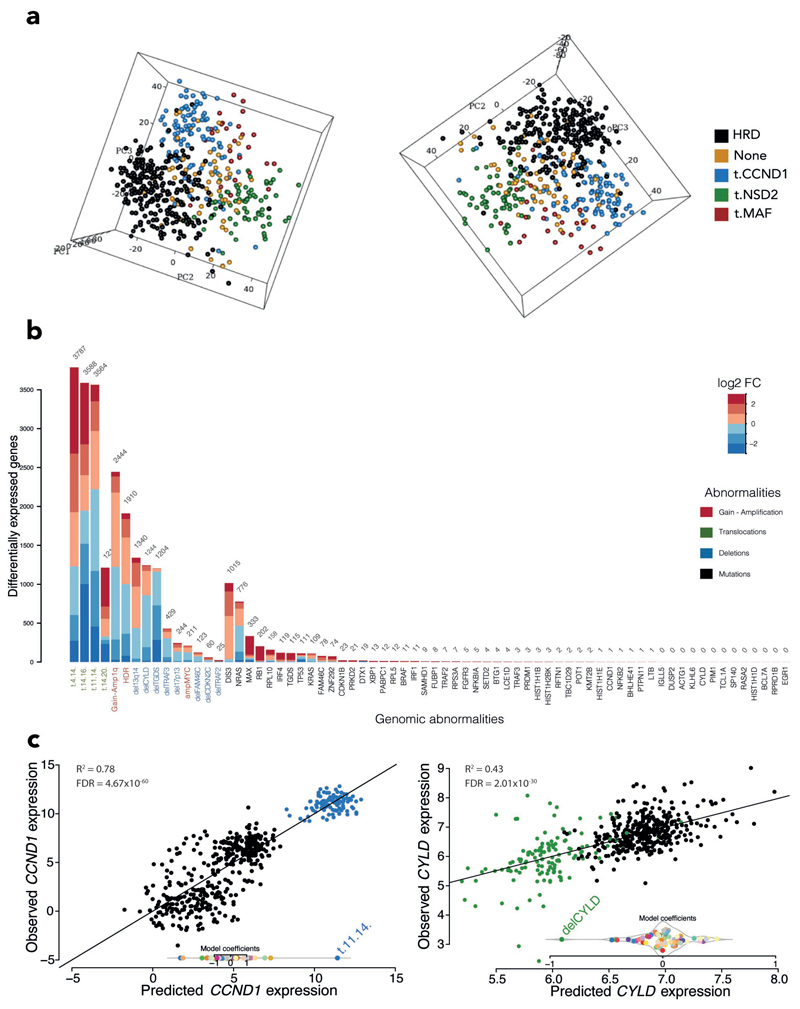
Figure 1. Transcriptomic profile.
A, Principal component analysis based on the main karyotypic subtypes: samples are represented as dots in the space identified by the 3 principal components and are color-coded based on their karyotype. B, Stacked bar chart showing the differentially expressed genes per each genomic abnormality (FDR<0.05, fold change cut-off 1.5). Bars indicate the contributions of upregulated genes (red) and downregulated genes (blue). FC, fold change. C, Scatterplot representing expression prediction for the CCND1 and CYLD genes versus observed expression values: samples are color-coded dots based on the significant genomic abnormality (FDR<0.01), in blue t(11;14) samples, in green del(CYLD) samples and in black the other samples; R2 represents the association between genomic alteration and expression changes.

