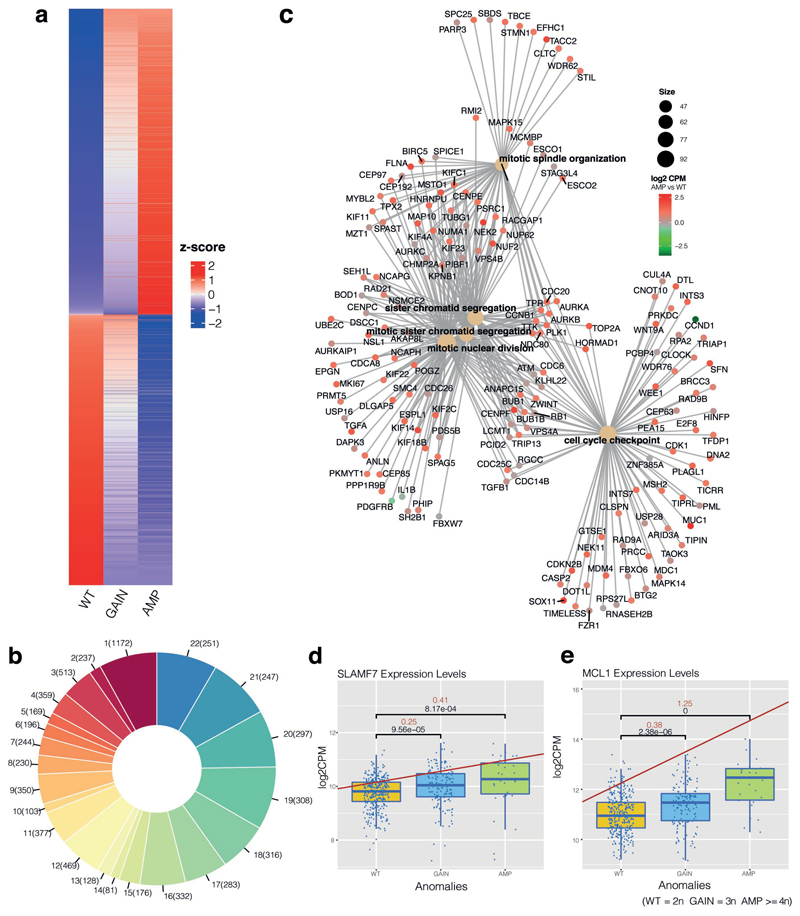
Figure 4. Chromosome 1q gain/amplification analysis.
A, The heatmap represents the z-score values for the cumulative effect genes. B, The pie chart represents the chromosomal distribution of the cumulative effect genes, corrected for chromosomal length. C, Gene-network plot for cumulative effect genes, related to the amplification versus WT contrast (log2CPM). D, Box plot for the SLAMF7 expression trend in the 3 statuses. E, Box plot for MCL1 expression trend.

