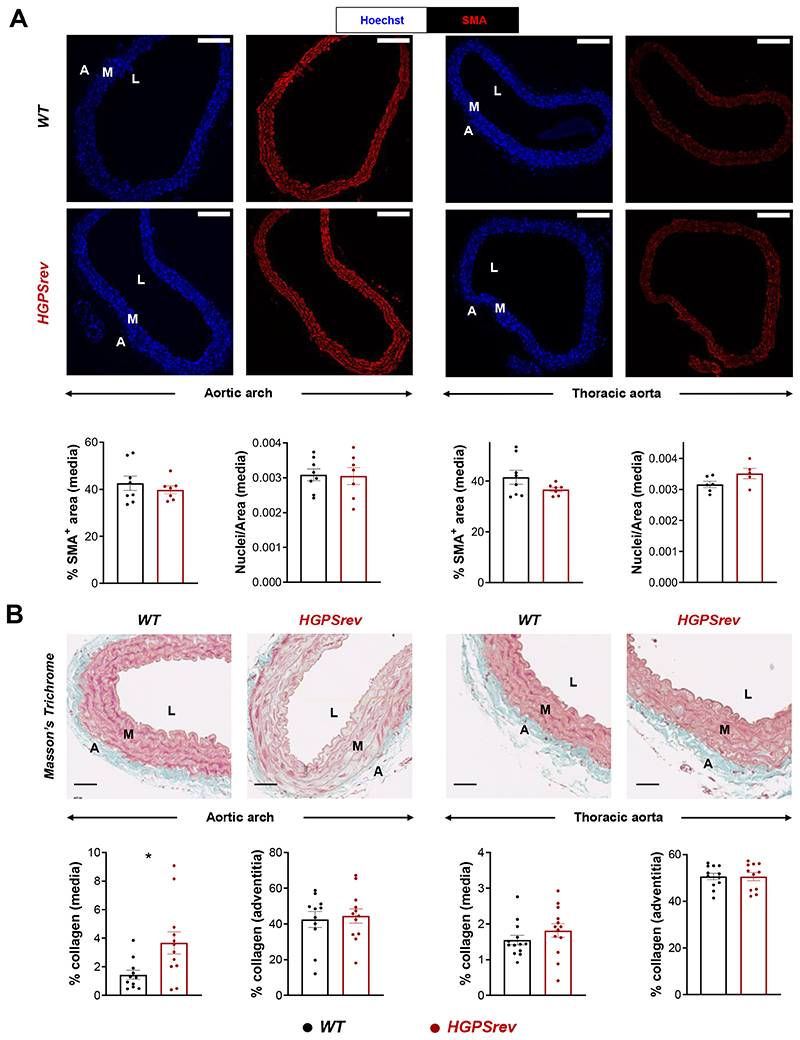
Figure 4. Vascular smooth muscle cell (VSMC) content and collagen deposition in the aortas of ≈8-month-old HGPSrev mice.
(A) Representative immunofluorescence of cross-sections of aortic arch (LEFT) and thoracic aorta (RIGHT) stained with anti-smooth muscle α-actin (SMA) antibody (red) and Hoechst 33342 (blue) to visualize vascular smooth muscle cells (VSMCs) and nuclei, respectively. Graphs show quantification of VSMC content in the media as either the percentage (%) of SMA-positive area or nuclear density (n=6-8 WT; n=5-7 HGPSrev). Scale bar, 150 μm. (B) Representative images and quantification of Masson’s trichrome staining to visualize medial and adventitial collagen content in cross-sections of aortic arch (LEFT) and thoracic aorta (RIGHT) (n=11-13 WT; n=11-13 HGPSrev). Scale bar, 50 μm. Data are mean±SEM. Each symbol represents one animal. Statistical analysis was performed by two-tailed t-test (*, p<0.05). A, adventitia; L, lumen; M, media.

