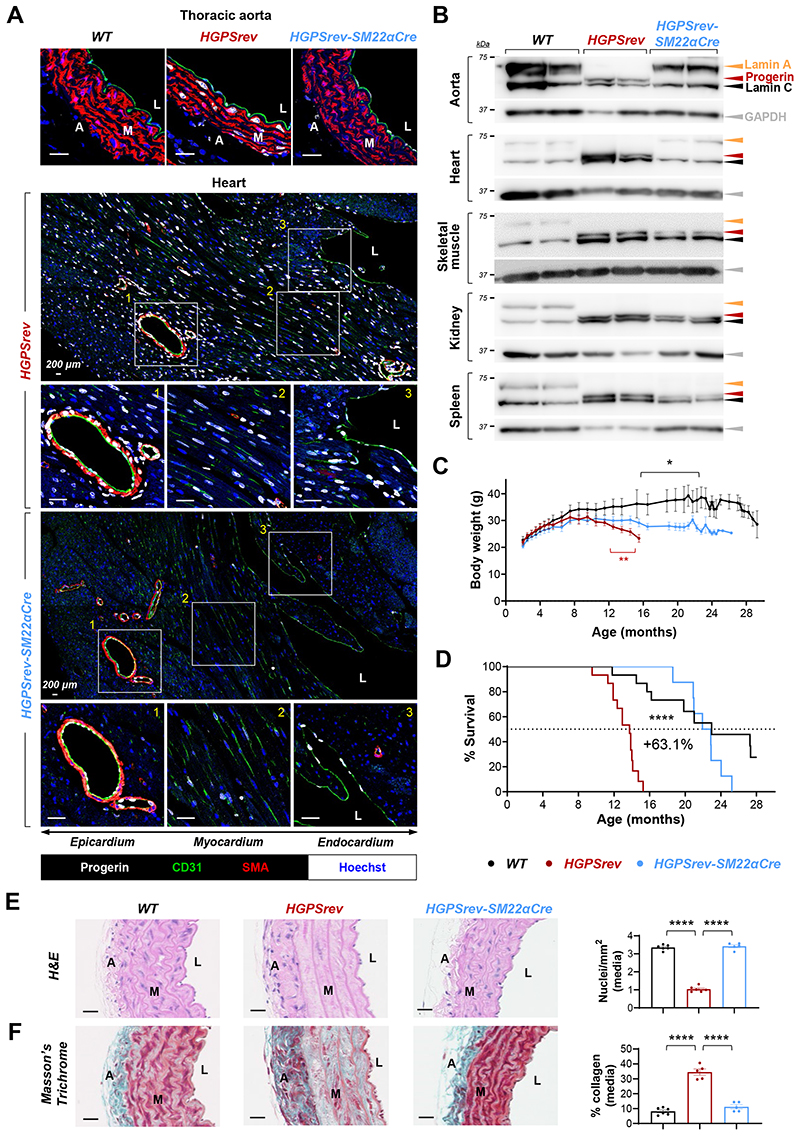
Figure 8. Normal vascular phenotype and lifespan in HGPSrev-SM22α-Cre mice with progerin suppression and lamin A restoration restricted to vascular smooth muscle cells (VSMCs) and cardiomyocytes.
(A) Representative immunofluorescence images of thoracic aorta and hearts of ≈l3-month-old mice. Cross-sections were co-stained with antibodies against CD31 (green), smooth muscle α-actin (SMA) (red) and progerin (white) and with Hoechst 33342 (blue) to visualize endothelial cells, vascular smooth muscle cells, progerin, and nuclei, respectively. (B) Western blot of lamin A/C, progerin and GAPDH in tissues of ≈l3-month-old mice. (C) Body-weight curves (n=9 WT; n=13 HGPSrev, n=11 HGPSrev-SM22α-Cre). Differences were analyzed by unpaired multiple t-tests and the Holm-Sídák correction. Red asterisks denote differences between HGPSrev-SM22α-Cre and HGPSrev mice. Black asterisks denote differences between HGPSrev-SM22α-Cre and WT mice. (D) Kaplan-Meier survival curve (n=15 WT; n=15 HGPSrev; n=11 HGPSrev-SM22α-Cre). Median lifespan was 13.73 months in HGPSrev mice, 22.4 months in HGPSrev-SM22α-Cre mice, and 22.97 months in WT mice. Differences were analyzed with the Mantel-Cox test. (E, F) Representative images of aortic arch stained with hematoxylin & eosin (H&E) and Masson’s trichrome, to quantify vascular smooth muscle cells (VSMCs) and fibrosis, respectively, in ≈l3-month-old WT mice (n=6), HGPSrev mice (n=5-6), and HGPSrev-SM22α-Cre mice (n=5). Differences were analyzed by one-way ANOVA with the post-hoc Tukey test. *, p<0.05; ****, p<0.0001. Each symbol represents one animal. Data are mean±SEM. A, adventitia; L, lumen; M, media. Scale bars, 25 μm (except the ones in the tile scans in panel A, where they account for 200 μm).

