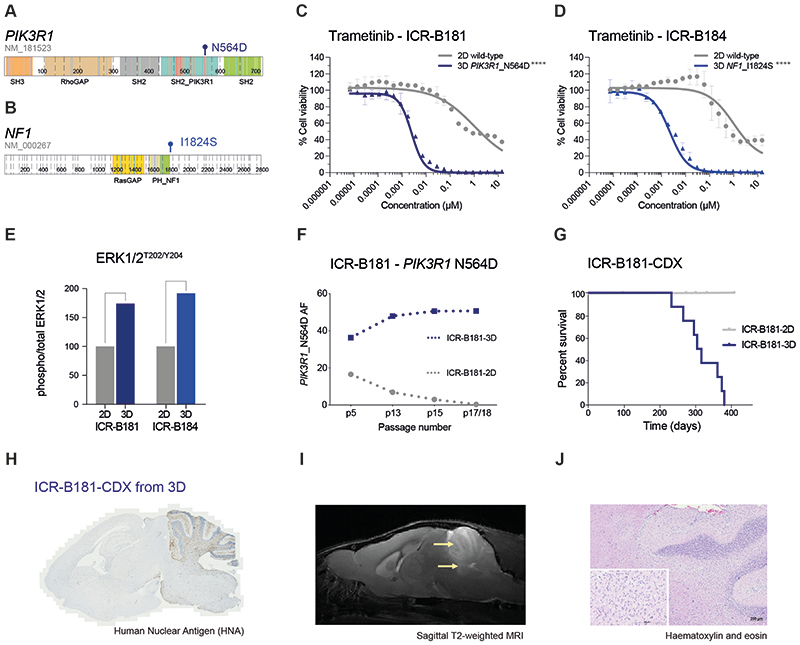
Figure 2. PIK3R1 and NF1 mutations drive the sensitivity of DIPG cells to trametinib.
(A) Cartoon representing the protein domains of PIK3R1 showing the mutant residue for the observed hotspot N564D mutation observed in ICR-B181. (B) Cartoon representing the protein domains of NF1 showing the mutant residue for the observed I1824S missense mutation observed in ICR-B184. Generated in ProteinPaint (pecan.stjude.cloud/proteinpaint). (C) Dose-response validation curves for trametinib tested against ICR-B181 cells in vitro grown in 3D (PIK3R1_N564D, blue) and 2D (PIK3R1 wild-type, grey). (D) Dose-response curves for trametinib tested against ICR-B184 cells in vitro grown in 3D (NF1_I1824S, blue) and 2D (NF1 wild-type, grey). Concentration of compound is plotted on a log scale (x axis) against cell viability (y axis). Mean plus standard error are plotted from at least n=3 experiments. ****p<0.0001, AUC t-test. (E) Barplot of quantitative capillary phospho-protein assessment of phospho-ERK1/2T202/Y204, plotted as a ratio to total ERK1/2, and normalised to the 2D (MAPK wild-type) model in each case. (F) Variant allele frequency (VAF, y axis) of PIK3R1-N564D in ICR-B181 cells grown in 3D (blue) and 2D (grey) over time, as measured by ddPCR. Passage number of cells assessed is given on the x axis. (G) Survival curves for ICR-B181-CDX models, separated by mice implanted with cells grown as either 2D (grey) or 3D (blue). (H) Anti-human nuclear antibody (HNA), staining for ICR-B181-CDX derived from cells grown in 3D, with extensive tumour cell infiltration. Sagittal sections, counterstained with haematoxylin. (I) sagittal T2-weighted image (day 246 post-implantation) for ICR-B181-CDX derived from cells grown in 3D, showing hyperintense tumour throughout the cerebellum and upper pons (indicated by arrow). (J) Haematoxylin and eosin stained section of ICR-B181-3D CDX, showing histology consistent with high grade glioma. Scale bar is 200μm.

