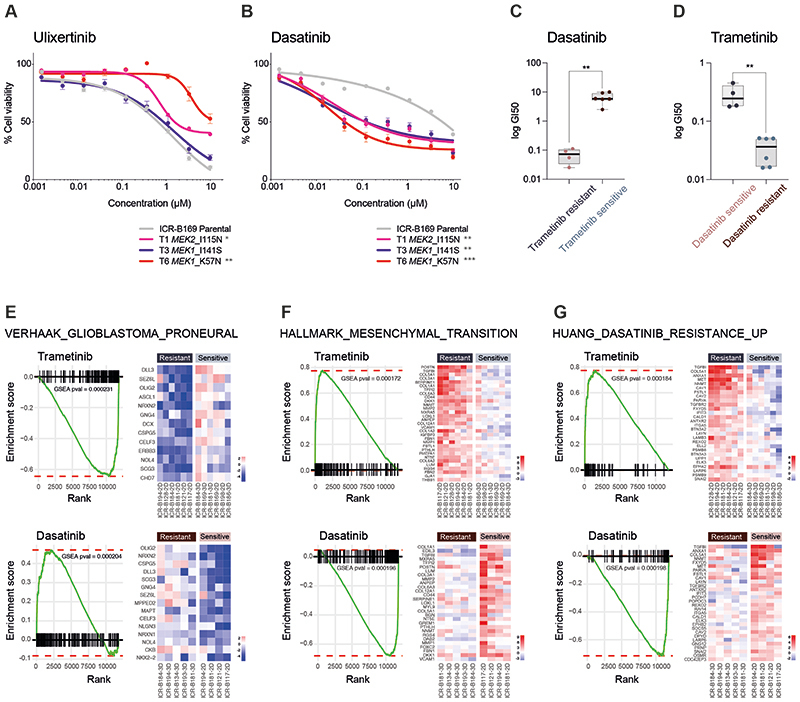
Figure 5. Reciprocity of drug sensitivities and gene expression signatures between trametinib and dasatinib in DIPG cells.
(A) Dose-response curves for ulixertinib tested against ICR-B169 parental cells (grey) and resistant clones T1 (MEK2_I115N, pink), (T3 MEK1_I141S, purple) and T6 (MEK1_K57N, red). (B) Dose-response curves for dasatinib tested against ICR-B169 parental cells (grey) and resistant clones. Concentration of compound is plotted on a log scale (x axis) against cell viability (y axis). Mean plus standard error are plotted from at least n=3 experiments. ***p<0.001, **p<0.01, *p<0.05, AUC t-test. (C) Boxplot of dasatinib GI50 values (log scale, y axis) for primary patient-derived cultures separated by trametinib sensitivity status. (D) Boxplot of trametinib GI50 values (log scale, y axis) for primary patient-derived cultures separated by dasatinib sensitivity status. ** p<0.001, t-test. (E) Gene set enrichment analysis (GSEA) enrichment plots for the signature VERHAAK_GLIOBLASTOMA_PRONEURAL in primary patient-derived cultures separated by trametinib (top) or dasatinib (bottom) sensitivity status. The curves show the enrichment score on the y axis and the rank list metric on the x axis. Alongside are heatmap representations of expression of significantly differentially expressed genes in the signature in all trametinib or dasatinib resistant versus sensitive cell cultures. (F) Gene set enrichment analysis (GSEA) enrichment plots for the signature HALLMARK_EPITHELIAL_ MESENCHYMAL_TRANSITION in primary patient-derived cultures separated by trametinib (top) or dasatinib (bottom) sensitivity status. The curves show the enrichment score on the y axis and the rank list metric on the x axis. Alongside are heatmap representations of expression of significantly differentially expressed genes in the signature in all trametinib or dasatinib resistant versus sensitive cell cultures. (G) Gene set enrichment analysis (GSEA) enrichment plots for the signature HUANG_DASATINIB_RESISTANCE_UP in primary patient-derived cultures separated by trametinib (top) or dasatinib (bottom) sensitivity status. The curves show the enrichment score on the y axis and the rank list metric on the x axis. Alongside are heatmap representations of expression of significantly differentially expressed genes in the signature in all trametinib or dasatinib resistant versus sensitive cell cultures.

