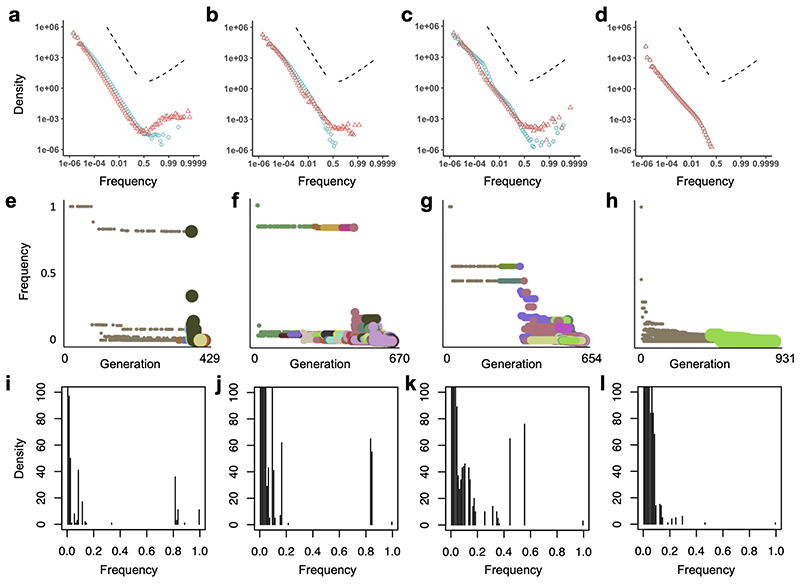
Extended Data Fig. 10. Mutation frequency distributions for simulated tumours.
a-d, Complete mutation frequency distributions for models with only neutral mutations (blue points) or both neutral and driver mutations (red points). Each distribution represents combined data from 100 simulations of each of the four model types of Figures 2 and 3. To clarify the shape of the distributions, especially at high frequencies, the x-axes are transformed as logit(x) = log(x/(1 − x)), which is approximately equal to log x when x is much less than 1. Dashed lines indicate the slope predicted for an exponentially-growing population acquiring only neutral mutations (negative slope) and a prediction of the Bolthausen-Sznitman coalescent (positive slope), which has been shown to describe genealogies when a constant-size population expands into uninhabited territory5 or when a constant-size population acquires both neutral and highly beneficial mutations.6 e-h, Mutation frequency versus timing of mutation for the specific model instances of Figure 2. Point colour corresponds to clone (as in Figure 2), and size corresponds to the division rate of cells within the clone. Driver mutations are typically preceded by a string of hitchhiking passenger mutations with similar frequencies. This figure format is inspired by Figure 2 of ref 4. i-l, Mutation frequency distributions for the specific model instances of Figure 2, with linear axes. Results are shown for a non-spatial branching process (a, e, i); tumour growth via gland fission (b, f, j); cell dispersal throughout the tumour and at the tumour boundary (c, g, k); and a boundary-growth model (d, h, l). Parameter values are the same as in Figures 2 and 3.

