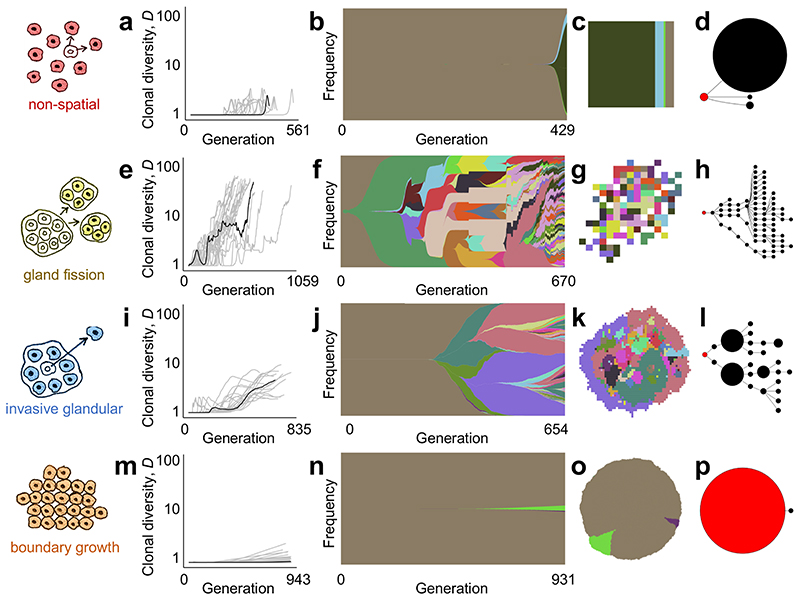
Figure 2. Four modes of tumour evolution predicted by our model.
a, Dynamics of clonal diversity (inverse Simpson index D) in 20 stochastic simulations of a non-spatial model. Black curves correspond to the individual simulations illustrated in subsequent panels (having values of D and mean number of driver mutations n closest to the medians of sets of 100 replicates). b, Muller plot of clonal dynamics over time, for one simulated tumour according to the non-spatial model. Colours represent clones with distinct combinations of driver mutations (the original clone is grey-brown; subsequent clones are coloured using a recycled palette of 26 colours). Descendant clones are shown emerging from inside their parents. c, Final clone proportions. d, Driver phylogenetic trees. Node size corresponds to clone population size at the final time point and the founding clone is coloured red. Only clones whose descendants represent at least 1% of the final population are shown. e-h, Results of a model of tumour growth via gland fission (8,192 cells per gland). In the spatial plot (g), each pixel corresponds to a patch of cells, corresponding to a tumour gland, coloured according to the most abundant clone within the patch. i-l, Results of a model in which tumour cells disperse between neighbouring glands and invade normal tissue (512 cells per gland). m-p, Results of a boundary-growth model of a non-glandular tumour. In all cases, the driver mutation rate is 10-5 per cell division, and driver fitness effects are drawn from an exponential distribution with mean 0.1. Other parameter values are listed in Supplementary Table 4.

