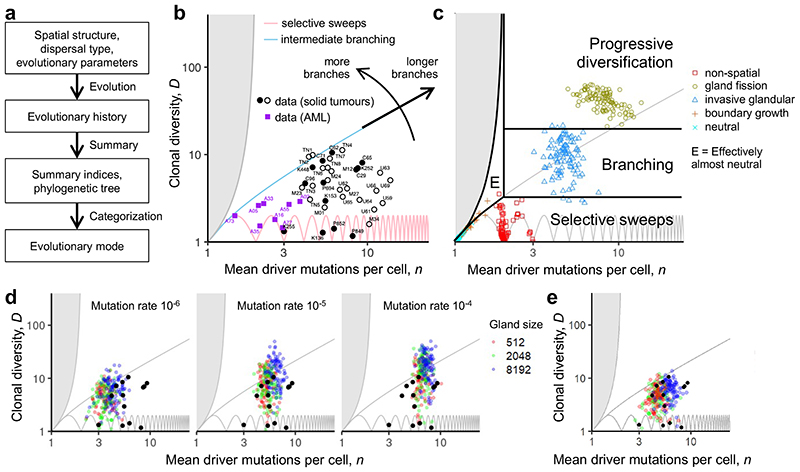
Figure 3. Using summary indices to characterize modes of tumour evolution.
a, Causal relationships between biological parameters, summary indices, and mode of tumour evolution. Tumour architecture, cell dispersal type and other parameters shape the stochastic evolutionary process that gives rise to evolutionary mode. We use evolutionary indices to characterize the modes. b, Relationship between clonal diversity D, mean driver mutations per cell n, and tree topology. Each location within the unshaded region corresponds to a distinct subset of phylogenetic trees. The lower boundary (clonal diversity = 1) corresponds to linear trees in which only one node has size greater than zero (that is, the population comprises only one extant clone). The sequence of pink curves near the lower boundary traces the trajectory of a population that evolves via sequential selective sweeps, so that, at any given time, at most two nodes have size greater than zero. The boundary of the shaded region at the left corresponds to star-shaped trees. It is impossible to construct trees for locations within the shaded region. The number of main branches per tree typically increases along anti-clockwise curves between the two boundaries (black arrow). Solid black discs show evolutionary indices derived from multi-region sequencing data for kidney cancers (code suffix K), lung cancers (C) and breast cancers (P). Hollow black circles show evolutionary indices derived from multi-region sequencing data for mesothelioma (M) and single-cell sequencing data for breast cancers (TN) and uveal melanoma (U). Purple squares show evolutionary indices derived from single-cell sequencing data for acute myeloid leukaemia (AML; code suffix A). The pale blue curve corresponds to a particular intermediate degree of branching (Methods; Supplementary information). Patient codes match those in the original publication except where abbreviated by the following patterns: A02 = AML-02-001, C29 = CRUK0029, P694 = PD9694; M01 = MED001; U59 = UMM059. c, Summary metrics of four example models with different spatial structures and different manners of cell dispersal but identical driver mutation rates and identical driver mutation effects (100 stochastic simulations per model). Neutral counterparts of the four models are represented together as an additional group. Black curves separate four modes of tumour evolution defined in terms of indices n and D (see also Table 1). Region “E” corresponds to the effectively almost neutral mode. d, Evolutionary indices for invasive glandular models with driver fitness effects drawn from an exponential distribution with mean 0.2, and with varied gland size and mutation rate. e, Evolutionary indices for an invasive glandular model after adjustment to simulate imperfect sequencing sensitivity (driver mutations with frequency below 5% are removed from the model output). Solid black discs in panels d and e are the same as in panel b. Except where specified, parameter values in panels c, d and e are the same as in Figure 2.

