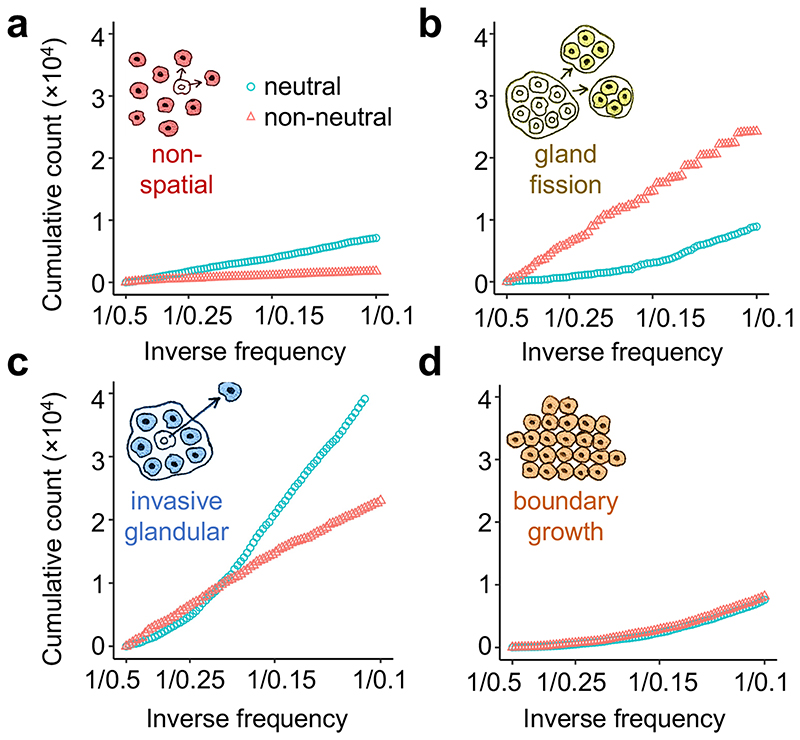
Figure 5.
a-d, Mutation frequency distributions predicted by our model for simulations with only neutral mutations (blue circles) or both neutral and driver mutations (red triangles). Cumulative mutation count is plotted against inverse mutation frequency (1/f), restricted to mutations with frequencies between 0.1 and 0.5. Each distribution represents combined data from 100 simulations.

