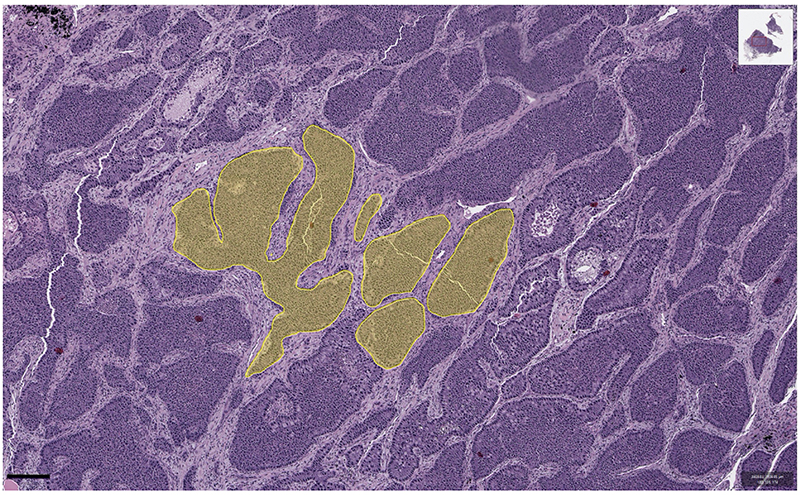
Extended Data Fig. 3. Quantification of tumour cell numbers per gland in a breast cancer histology slide.
Multiple glands were manually outlined and the number of cells in each gland was counted automatically. Shaded areas are cell masks obtained with QuPath. The original image was retrieved from The Cancer Genome Atlas at https://portal.gdc.cancer.gov (patient TCGA-49-AARR, slide 01Z-00-DX1).

