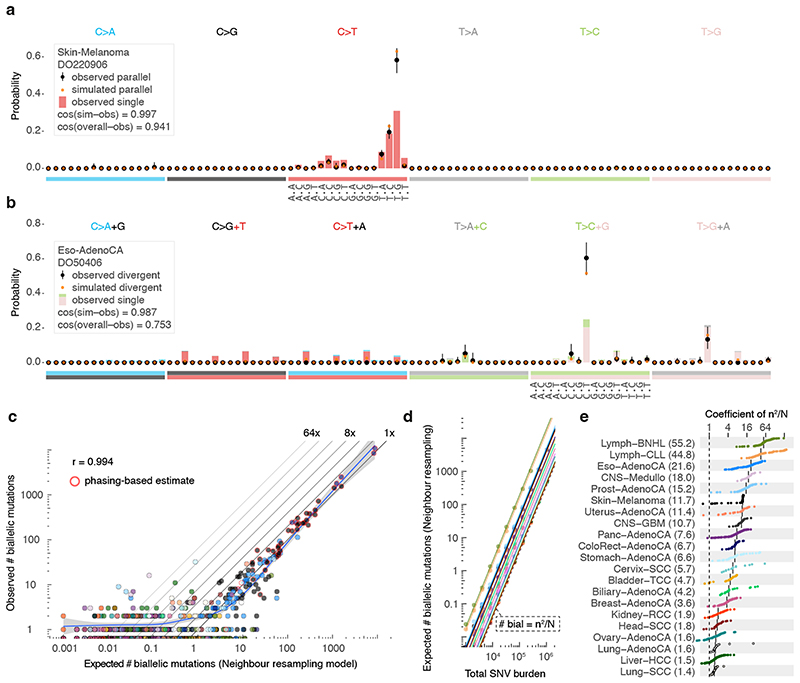
Figure 4. Comparison between observed and simulated biallelic mutations.
(a) Bar chart highlighting the mutation spectrum of observed and predicted parallel mutations (circles) as well as the background SNVs for melanoma DO220906 (bars). Cosine similarities between the spectra are indicated. Error bars represent the 95% confidence intervals obtained from a Dirichlet-multinomial model of the observed biallelic parallel mutation type counts with a uniform Dirichlet prior. (b) Similar as (a) but showing divergent mutations for oesophageal adenocarcinoma DO50406. Bars are stacked to reflect the frequency of the colour-coded base changes indicated on top. ( c ) Scatterplot of the observed vs. neighbour resampling model-expected number of biallelic mutations (parallel + divergent) for all PCAWG tumours. For cases with ≥10,000 phaseable SNVs (red borders), the phasing-based number is provided. Colours reflect tumour type as in Figure 2. The Pearson correlation and a spline regression fit with 95% confidence interval (shaded grey) are shown. (d) Number of biallelic violations expected according to the neighbour resampling model for a range of mutation burdens and tumour types. The dashed line indicates the birthday problem estimate equal to the square of the mutation burden divided by the genome size (m2/N). Full coloured lines are the linear fits per tumour type. (e) Bar plot of the fitted coefficients of m2/N as derived in (d). For each tumour type, the ICGC donor ID indicates the representative tumour used.

