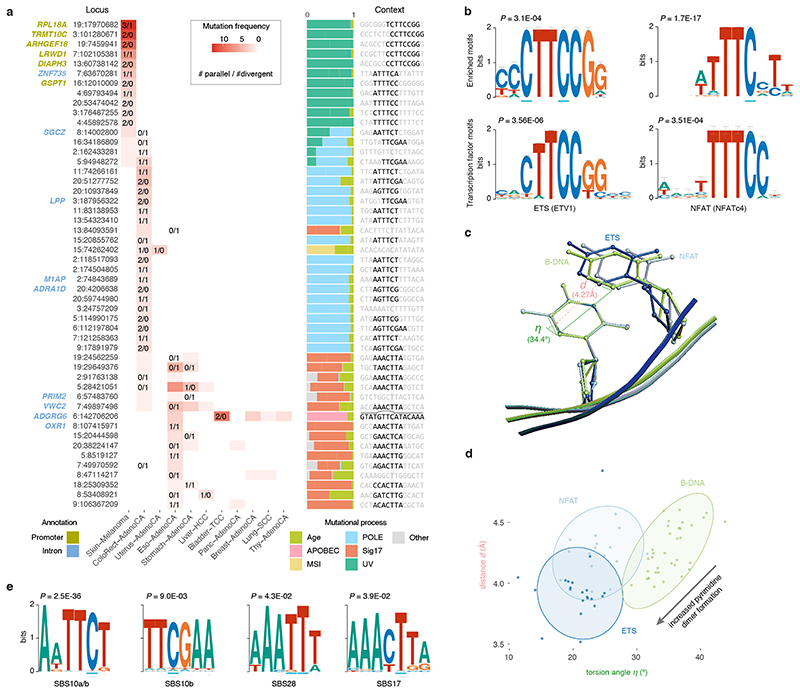
Figure 5. Biallelic mutations reveal hotspot motifs.
(a) Heatmap of the fifty most frequently mutated loci in PCAWG with at least one biallelic mutation. The number of parallel/divergent mutations at each site is indicated, as are gene annotations, the underlying mutational processes, and the local sequence context with emerging motifs. For chr6:142,706,206, part of the stem and loop of a local sequence palindrome are indicated. MSI, microsatellite instability. (b) Sequence logos of motifs enriched at loci with biallelic mutations in melanoma (top) and corresponding transcription factor recognition sequences (bottom). Error bars indicate the confidence of a motif based on the number of sites used in its creation. Fisher’s exact test is used to assess motif enrichment (top) while P-values for motif comparison (bottom) are computed and corrected for multiple testing according to Gupta et al. 17 . (c) Superposition of TpC dinucleotides in crystal structures of ETS-bound (GABP), NFAT-bound (NFAT1c) and free B-form DNA (PDB IDs, 1AWC, 1OWR and 1BNA, respectively). The distance d between the midpoints of the two adjacent C5-C6 bonds as well as their torsion angle η is indicated. (d) Scatter plot showing the distance d and angle η indicated in (c) for TpC dinucleotides in structures of ETS-bound (dark blue), NFAT-bound (blue) or free B-form DNA (green) obtained from the RCSB protein data bank (Supplementary Table 7). Ellipses represent the normal-probability contours of each group. Lower values of d and η increase the yield of UV-based pyrimidine dimer formation, as indicated by the arrow. (e) Sequence logos of motifs enriched at loci with biallelic mutations in colorectal adenocarcinoma (SBS10, 28) and oesophageal/stomach adenocarcinoma (SBS17). Fisher’s exact test is used to assess motif enrichment.

