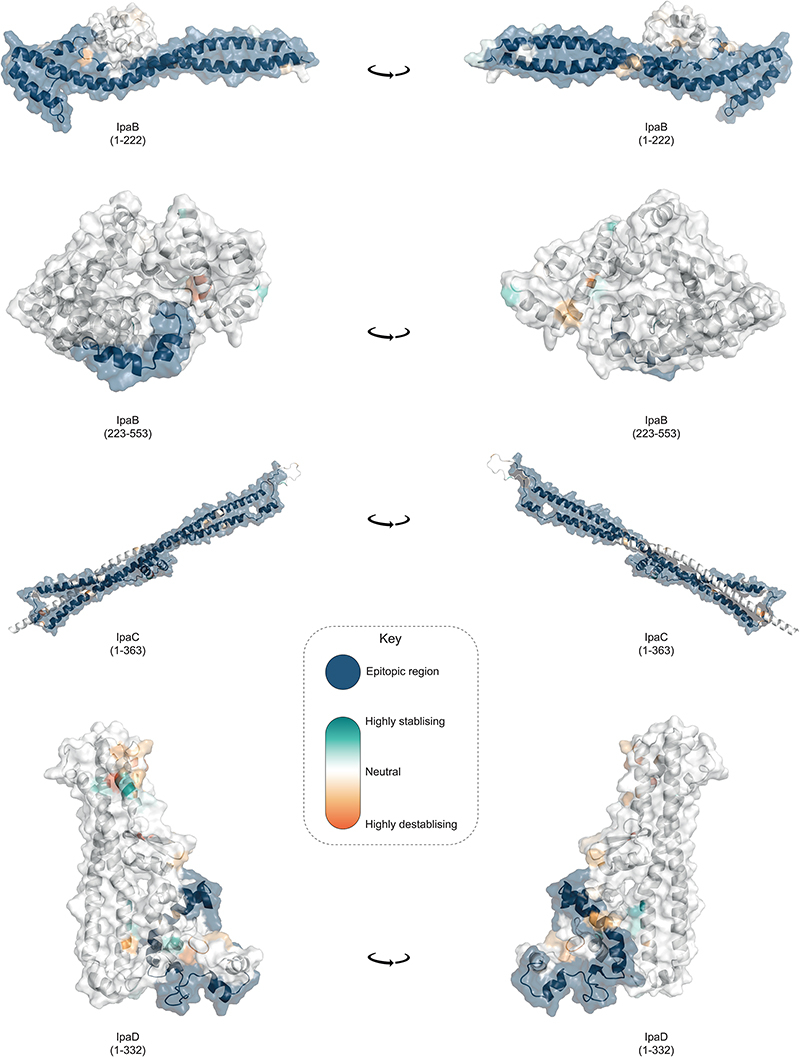
Fig. 4. Visualization of mutations and its predicted effect on modeled IpaB, IpaC and IpaD protein antigens.
Visualisation of mutations on modelled proteins IpaB, IpaC and IpaD. The protein residue ranges modelled are shown in brackets. Blue region represents empirically determined epitopes. Mutations identified within the proteins are coloured using the scale shown in the inlaid key, where highly destabilising mutations are dark orange and highly stabilising mutations are dark green.

