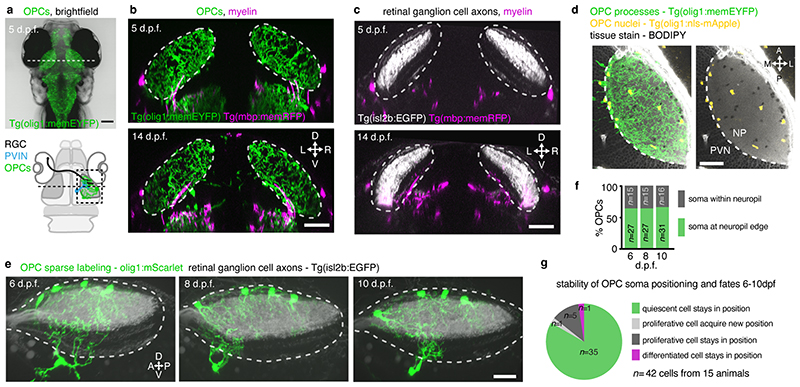
Fig. 1. The tectal neuropil of larval zebrafish is interspersed with OPC processes but largely devoid of myelin.
a) Transgenic zebrafish showing OPC processes throughout the brain. Dashed line indicates cross-sectional plane shown in b and c. Schematic of zebrafish brain delineates RGC axons, dendrites of periventricular interneurons (PVINs), and OPCs in tectal neuropil.
b and c) Cross sectional views of transgenic zebrafish showing that OPC processes intersperse the tectal neuropil (dashed lines) while myelin is largely absent. Scale bars: 50 μm.
d) Subprojection of OPC reporter lines (dorsal view) stained with BODIPY to outline tectal neuropil (NP) and the periventricular zone (PVZ) where cell bodies of PVINs reside. Dashed lines indicate border between NP and PVZ. Scale bar: 40 μm.
e)Time-lapse of four individual OPCs (lateral rotation view). Dashed lines depict tectal neuropil. Scale bar: 20 μm.
f and g) Quantifications of individual OPCs as shown in e showing low rates of soma position changes, division and differentiation.

