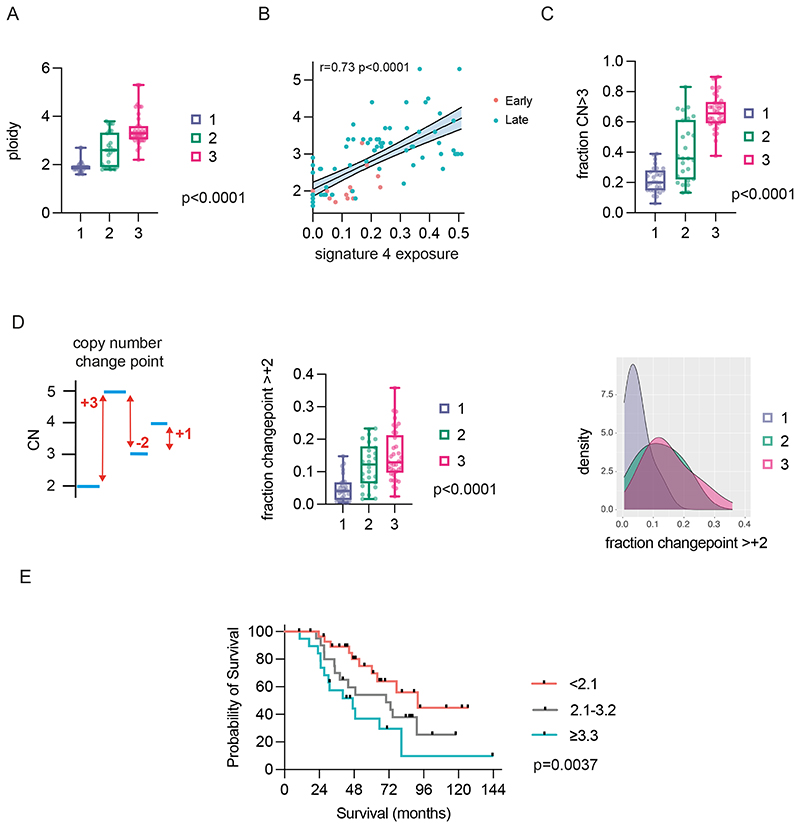
Figure 6. Cluster ploidy and whole genome duplication.
(A) Ploidy distribution of late-stage samples in three clusters. Kruskal Wallis test.
(B) Correlation between CN signature 4 exposure and ploidy across both cohorts. Spearman rank correlation.
(C) Fraction of CN segments with absolute copy number ≥3 in three clusters. Kruskal Wallis test.
(D) Copy number changepoint. Graphical depiction of CN changepoint (left); distribution of copy number changepoint ≥+2 in the three clusters. Kruskal Wallis test (centre); density distribution (right).
(E) Overall survival of combined early and late-stage cohorts by ploidy. Log-rank for trend analysis.

