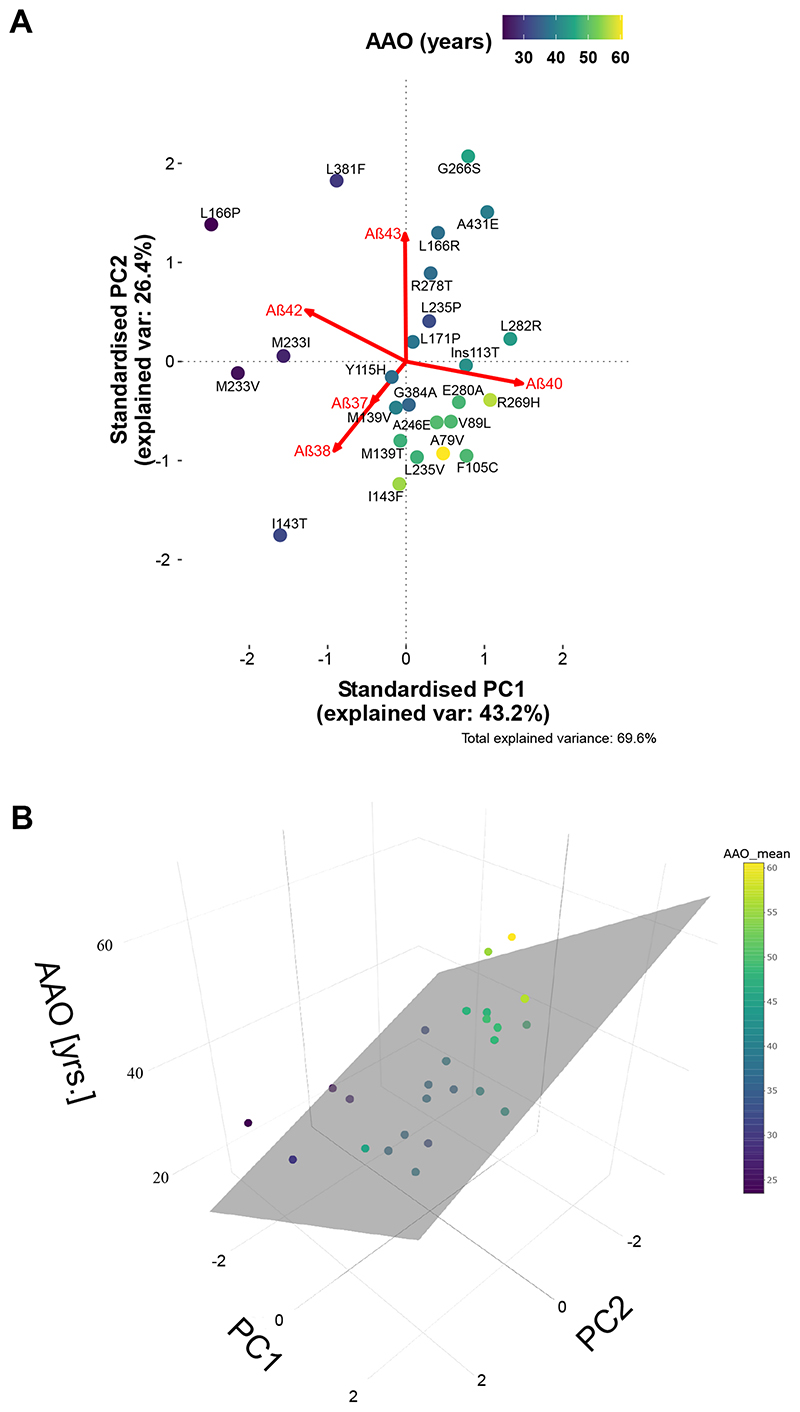
Figure 3. Principal component analysis of the Aβ profiles vs AAO.
(A) PCA biplot demonstrating the contribution of changes in the generation of particular Aβ species to the mutation severity (AAO). See also Figure S3 for further information about the PCA. (B) Multivariate linear model based on the data-driven PCA analysis to investigate the correlation with AAO.

