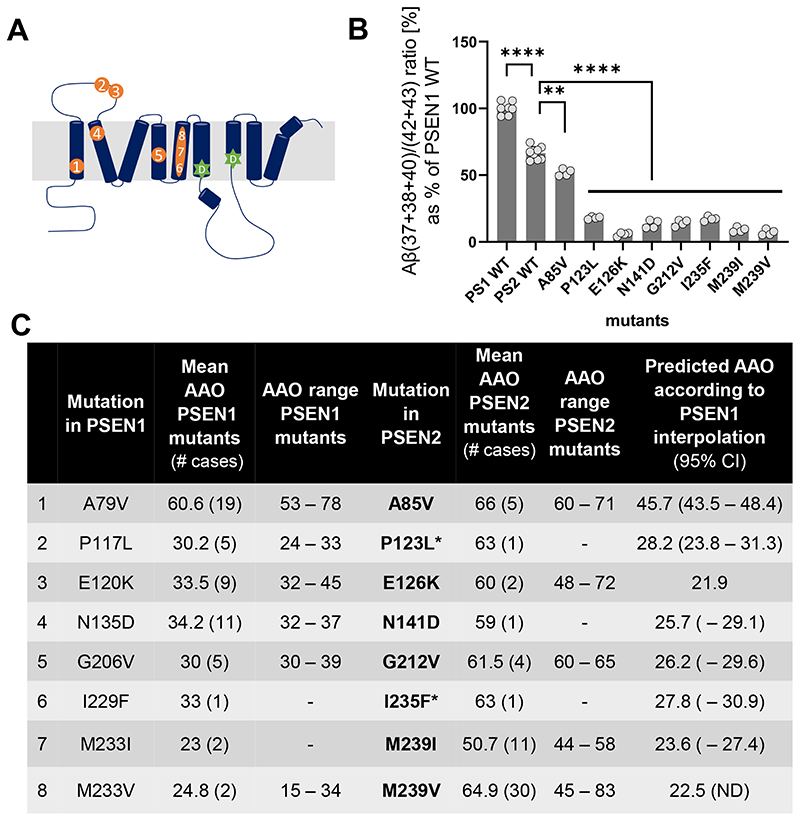
Figure 5. Aβ profiles generated by PSEN2-GSECs estimate the AAO of sister PSEN1 variants.
(A) Schematic representation of the localization of the tested PSEN mutations on the primary structure of PSEN1/2. (B) Efficiency of the 4th GSEC turnover quantified by the Aβ (37 + 38 + 40) / (42 + 43) ratio. One-way ANOVA followed by Dunnett’s post-hoc test with comparison to wild type was used to determine statistical significance p < 0.05; ** p < 0.01****p < 0.0001, (F(DFn, DFd): F (9, 37) = 147. Data are presented as mean ± SD of N ≥ 4 independent experiments. The corresponding PSEN2 Aβ profiles are shown in Figure S4C. (C) Table presents the estimated AAO for the indicated FAD-linked PSEN1 mutations. The 95% CIs of each AAO prediction are ‘lower limit’ and ‘upper limit’. *indicates mutations with unclear pathogenicity (https://www.alzforum.org/mutations/psen-2).

