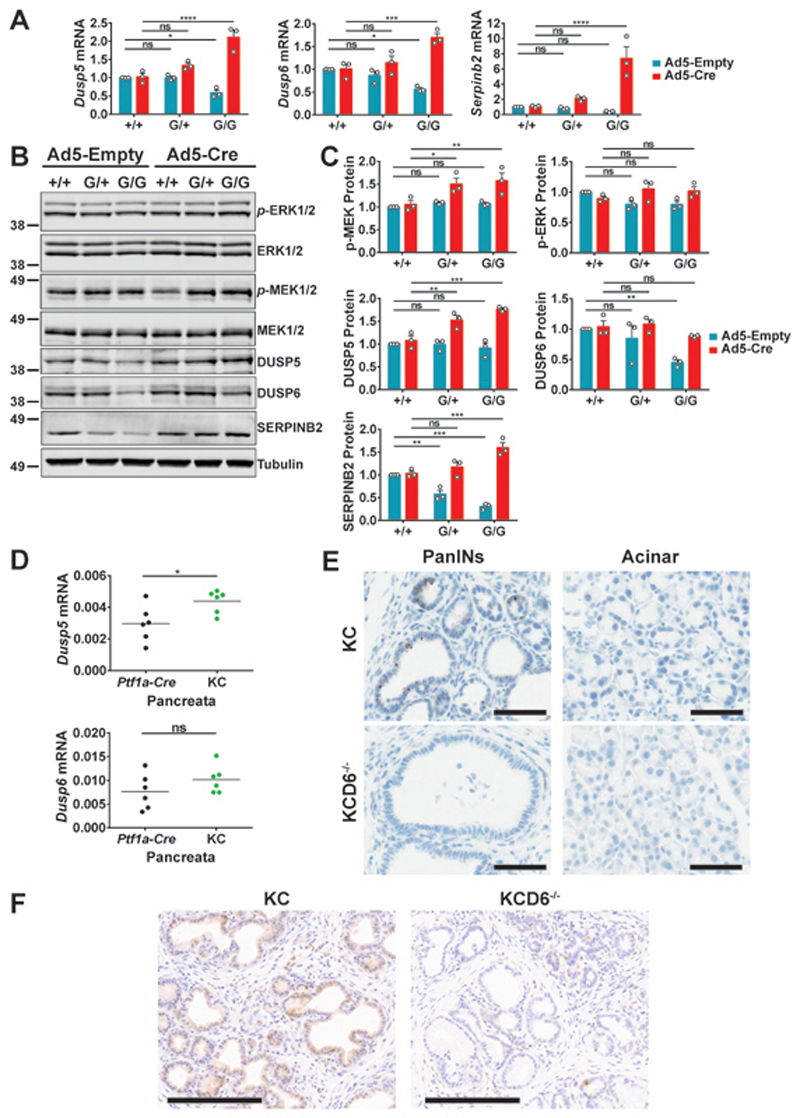
Fig. 1. Mutant KRASG12D leads to up-regulation of both DUSP5 and DUSP6 in MEFs and murine pancreas.
(A-C) Three sets of Kras+/+(+/+), KrasLSL-G12D/+ (G/+) and KrasLSL-G12D/LSL-G12D (G/G) MEF lines derived from independent littermates were infected with either empty adenovirus (Ad5-Empty) or adenoviral-Cre (Ad5-Cre) for 48 h prior to either RNA isolation (A), or immunoblotting using the indicated antibodies (B, C). (A) TaqMan RT-qPCR analysis of the indicated transcripts showing the fold change in mRNA levels relative to wild-type cells infected with empty adenovirus. (B) A Western blot representative of 3 independent experiments is shown, alongside graphs (C) showing the fold change in protein levels relative to wild-type cells infected with empty adenovirus. The tubulin blot is shown as a representative loading control (p-ERK1/2/ERK1/2). For all quantitative data mean values from 3 independent experiments (n = 3) ± SEM are shown, *P < 0.05, **P < 0.01, ***P < 0.001, ****P < 0.0001 using two-way ANOVA and Bonferroni post hoc test, comparing Kras genotypes. (D) TaqMan qRT-PCR analysis showing mRNA levels of Dusp5 or Dusp6, relative to Beta-actin (Actb), following RNA isolation from 100-day pancreata of the indicated cohorts. Mean values are shown from 6 pancreata per genotype (n = 6), ns = not significant, *P < 0.05, using an unpaired t-test. (E) Representative images of RNAscope in situ hybridisation for Dusp6 transcripts in 100-day pancreatic sections from the indicated cohorts. (Scale bars, 60μM.) The expression of Dusp6 transcripts is associated with KRASG12D-induced Pancreatic Intraepithelial Neoplasia (PanINs, upper left panel), while acinar tissue (upper right panel) displays low or undetectable levels of Dusp6 transcripts. The specificity of the RNAscope probe is demonstrated by the absence of staining in KCD6-/- tissue (lower panels). (F) Representative images of DUSP6 immunohistochemistry in 100-day pancreatic sections showing cytoplasmic DUSP6 staining in pre-neoplastic PanINs from KC (left panel), but not KCD6-/- (right panel) mice. (Scale bars, 200μM.) Cohorts consisted of the following genotypes: KrasLSL-G12D/+; ptf1a-Cre; Dusp+/+ (KC), KrasLSL-G12D/+; Ptf1a-Cre; Dusp6fl/fl (KCD6-/-).

