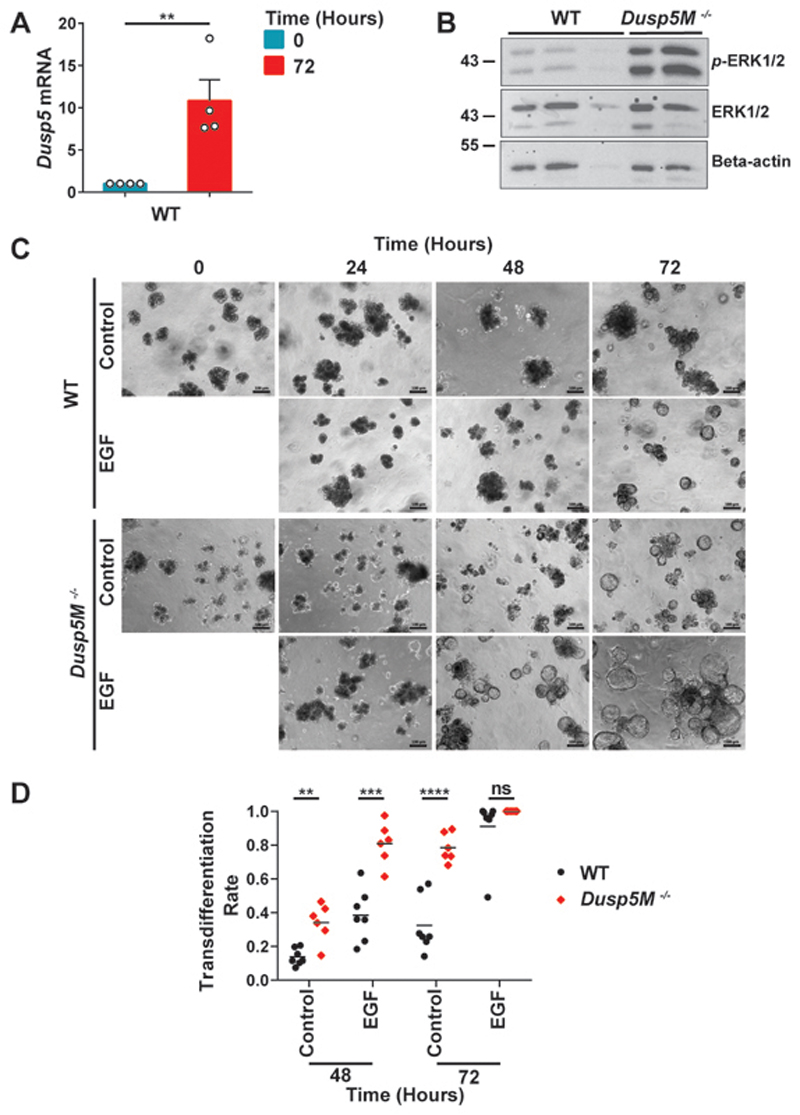
Fig. 3. Loss of DUSP5 results in increased levels of activated ERK1/2 and accelerates the transdifferentiation of pancreatic acinar cells in vitro.
(A) TaqMan RT-qPCR analysis showing mRNA levels of Dusp5, relative to Beta-actin (Actb) following RNA isolation from 3D acinar cultures at 0 and 72 h. Mean values from 4 independent experiments (n = 4) ± SEM are shown, **P < 0.01, using ratio paired t-test. (B) A representative Western Blot showing levels of activated ERK (p-ERK1/2), ERK1/2 and as a loading control, Beta-actin. Protein lysates were from 48 hmark 3D acinar cultures derived from independent mice of the indicated genotype (WT, n = 3; Dusp5M-/-, n = 2). (C) Representative images and quantification (D) of pancreatic acinar cells cultivated in a 3D in vitro model. (Scale bars, 100 μM.) Acinar cells were derived from either wild type (WT); n = 7 or Dusp5M-/- ; n = 6 mice and analysed morphologically based on the conversion of acinar cell clusters to ductal cyst structures that were comprised of a single layer of epithelial cells surrounding an empty luminal space. For each mouse and time point, the rate of transdifferentiation in 4 optical fields was determined. Cultures were either left untreated or stimulated by addition of epidermal growth factor (EGF; 25 ng/ml) to promote acinar cell transdifferentiation. Mean values are shown, ns = not significant, **P < 0.01, ***P < 0.001, ****P < 0.0001, using unpaired t-test with Welch’s correction.

