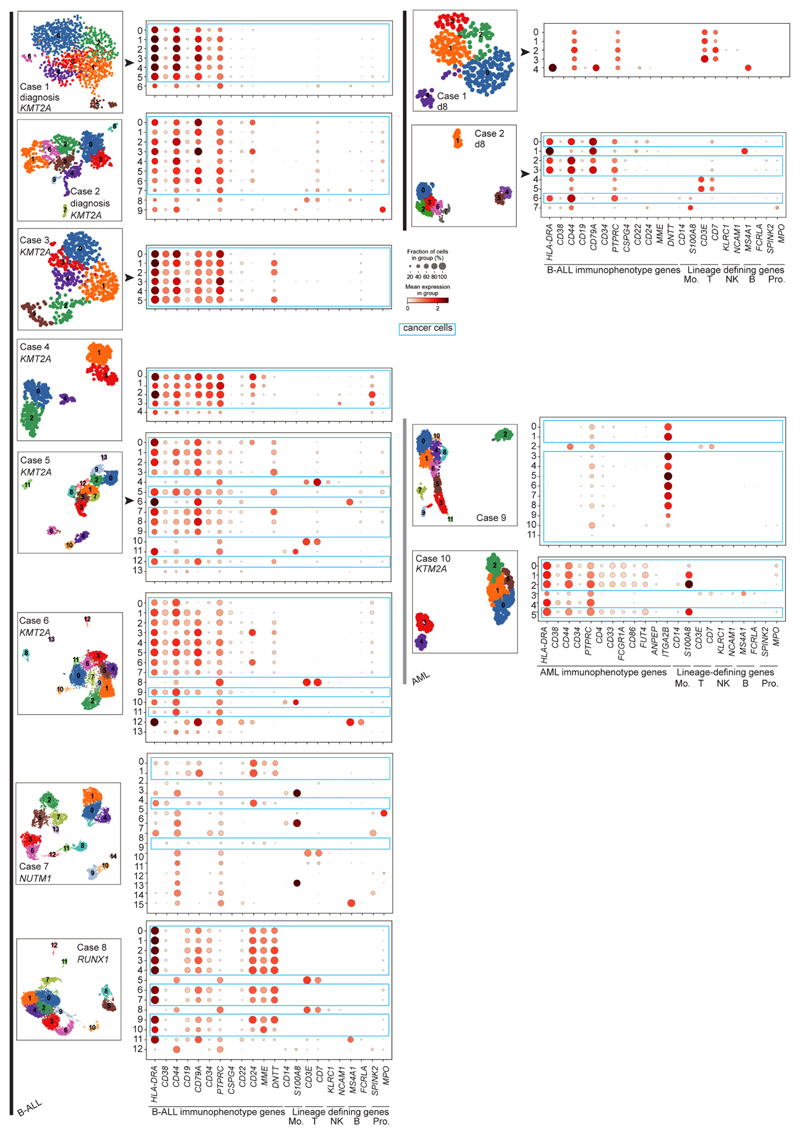
Extended Data Fig. 2. Identification of cancer cells in leukemia scRNA-seq data using immunophenotype gene expression.
UMAP projections of leukaemia scRNA-seq data sets, coloured by Louvain cluster. Accompanying dotplots show per-cluster expression of B-ALL immunophenotype genes or AML immunophenotype genes and lineage-defining genes of monocytes (Mo.), T cells (T), NK cells (NK), B cells (B) and progenitors (Pro.). Dot colour denotes log-transformed, normalised and scaled gene expression value, while dot size indicates percentage of cells in each cluster expressing the stated gene. Immunophenotypes are provided in Supplementary Table 4.

