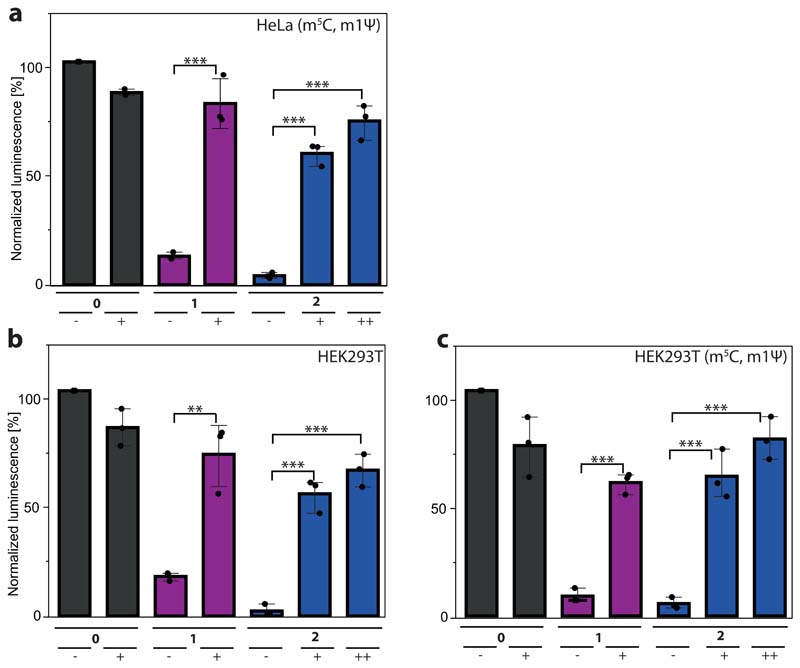
Extended Data Fig. 2. In-cell translation assay showing luciferase activity of FlashCap-GLuc mRNAs normalized to m7GpppG-mRNA.
The samples were either irradiated before transfection (++), in cells (+) or left untreated (-). a, Measured and normalized luminescence values, which were obtained from the cell media of HeLa cells that were previously transfected with differently capped GLuc-mRNA (containing m5C and m1Ψ) either irradiated or not irradiated in a 96 well plate. The P value for 1(+) versus 1(-) is 4.66 × 10⁻⁴. The P value for 2(+) versus 2(-) is 5.70 × 10⁻⁵. The P value for 2(++) versus 2(-) is 1.16 × 10⁻⁵. b, Measured and normalized luminescence values, which were obtained from the cell media of HEK293T cells that were previously transfected with differently capped GLuc-mRNA and either irradiated or not irradiated in a 96 well plate. The P value for 1(+) versus 1(-) is 3.57 × 10⁻³. The P value for 2(+) versus 2(-) is 1.7 × 10⁻⁴. The P value for 2(++) versus 2(-) is 4.3 × 10⁻⁴. c, Measured and normalized luminescence values, which were obtained from the cell media of HEK293T cells that were previously transfected with differently capped GLuc mRNA (containing m5C and m1Ψ) and either irradiated or not irradiated in a 96 well plate. The P value for 1(+) versus 1(-) is 9.05 × 10⁻⁴. The P value for 2(+) versus 2(-) is 9.32 × 10⁻⁴. The P value for 2(++) versus 2(-) is 2.09 × 10⁻⁴. Statistical significance was determined by two-tailed t-test. Data and error bars represent average and standard error of the mean of three independent (n=3) cell experiments. Significance-levels weredefinesas p<0.05:*, p<0.01:**, p<0.001:***.

