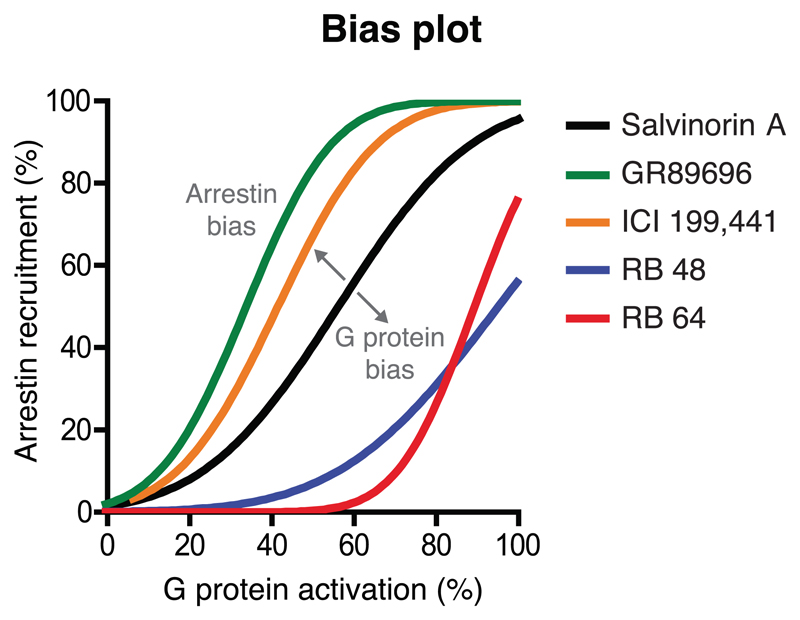
Figure 2.
Bias plot of an equimolar comparison of ligand-induced activities in two pathways. The plot is adapted from White et al., (2014) in which Salvinorin A was chosen as the reference ligand because it has a bias plot slope close to 1. GR89696 and ICI 199,441 are arrestin-biased and RB 48 and RB 64 are G protein-biased. The pathway percent activation could, for example, use ΔΔLog (Emax/EC50) or (ΔΔLog(τ/KA) values (see Section 6.2 and Box 1)

